


 Download PDF
- Policy Rates
- Central Bank Balance Sheets
- U.S. Dollar
Let's review how this thesis has been evolving over the past few months:
Policy Rates
The bluntest policy tool is the central bank overnight policy rate. We always posited that a shift in sentiment by the Federal Reserve (Fed) would be the cornerstone of the global easing cycle. Once its tone shifted and the Fed easing cycle commenced—three cuts and counting so far—we saw rate cuts by more than 30 central banks over the past six months. Particularly noteworthy is the fact that emerging market central banks have played a large role thus far, which may portend a more positive economic backdrop for them going into 2020. Therefore, the policy rates component of our forecast is on track so far. 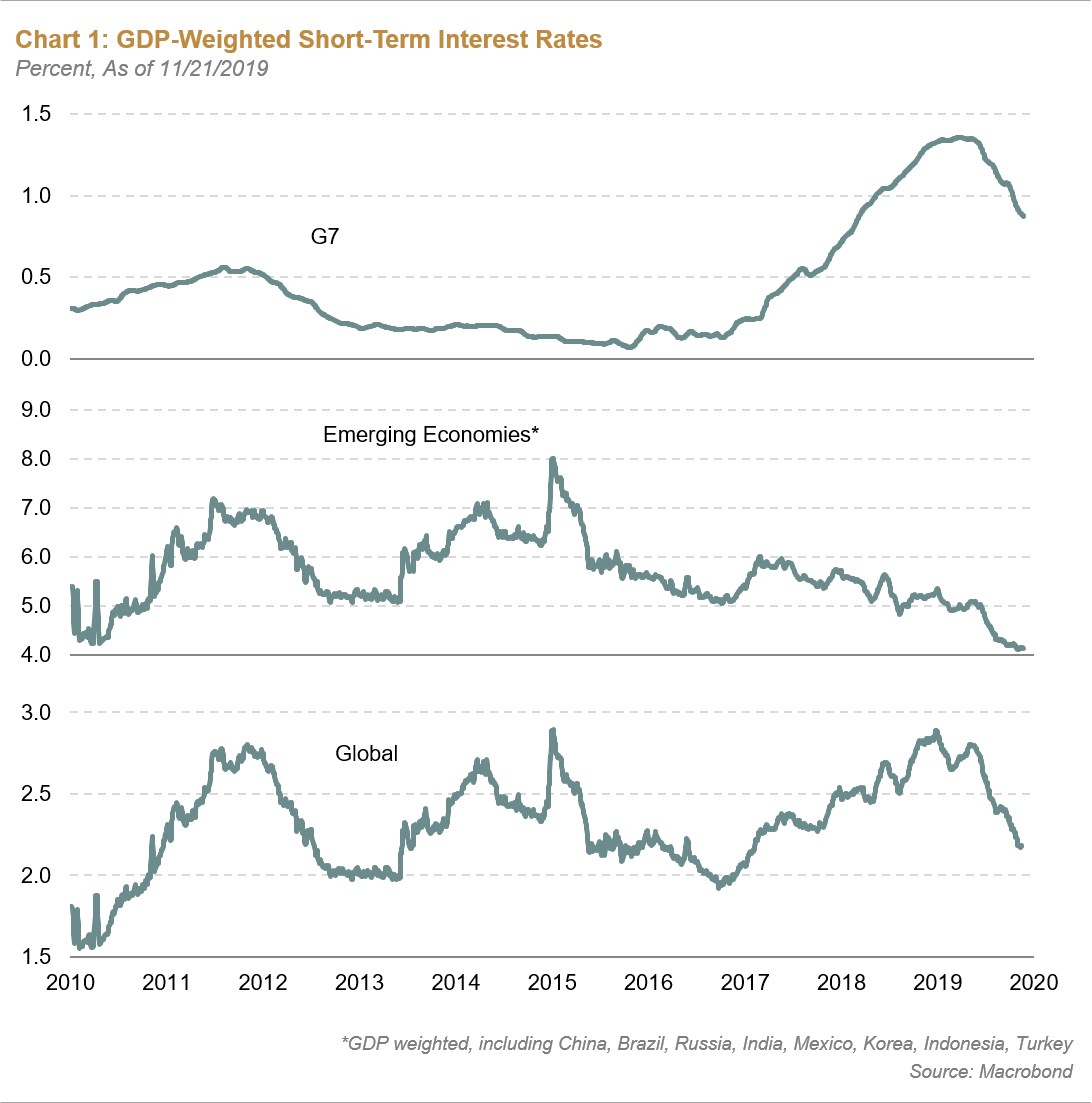
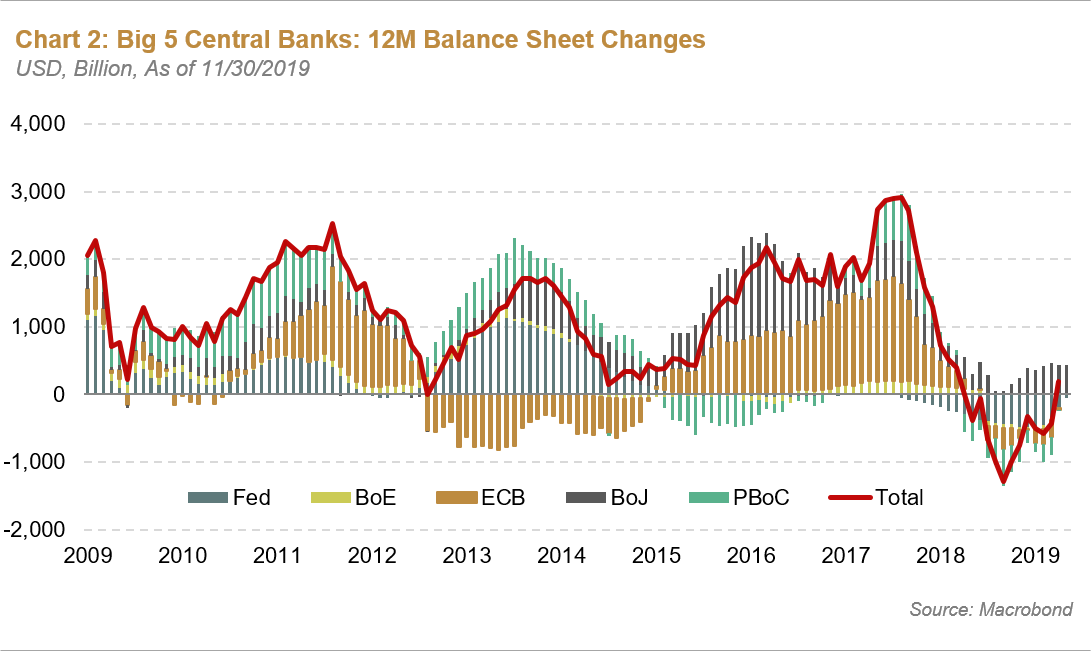
Central Bank Balance Sheets
However, perhaps the more noteworthy monetary policy shifts have been in balance sheets. Not only has the Fed ended its Quantitative Tightening (QT) program, but more recently, it has started to expand the balance sheet at the rate of $60B per month. The Fed has taken great pains to explain this shift is not Quantitative Easing (QE) but rather organic growth of the balance sheet that will help alleviate some of the recent stress observed in overnight funding markets. While this may be true, the impact on funding rates and dollar liquidity must surely be seen as a net positive. The change in the Fed's balance sheet coupled with the continuation of QE in Japan and its resumption in Europe on an open-ended basis, the environment transitioned quickly from one where liquidity was being reduced to one where it is being expanded on a global basis. The global aggregate central bank balance sheet has increased very much in line—or perhaps better than—our easing forecast.
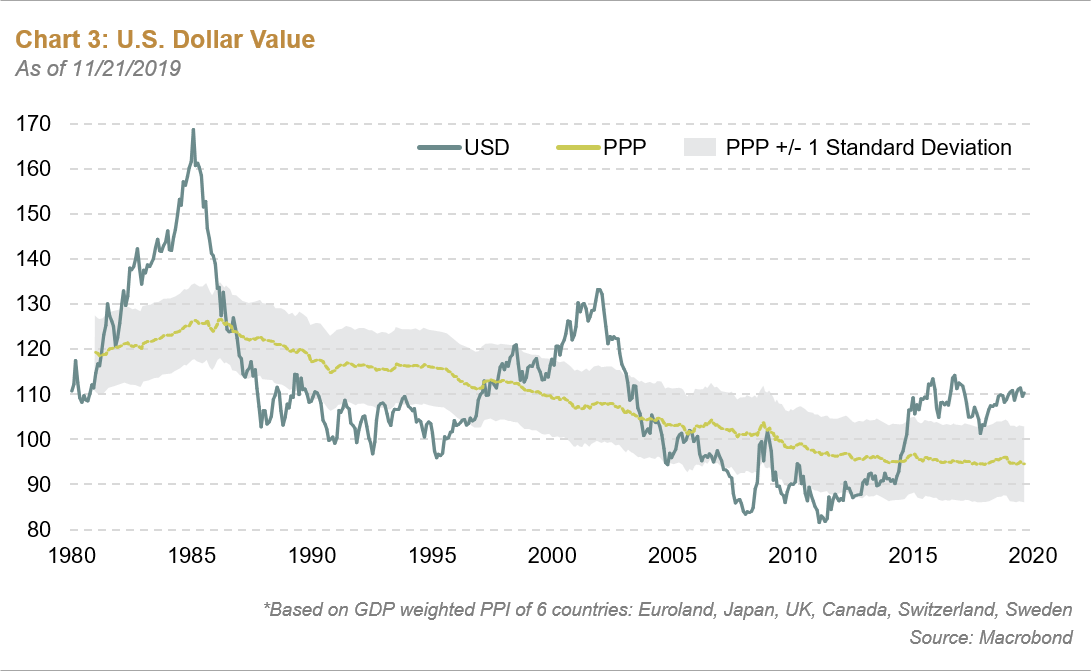
The U.S. Dollar
The third form of easing would be a weaker U.S. dollar. Our view earlier this year was that the potent cocktail of forces that drove the dollar higher in 2018 would moderate or reverse, namely:
- Fed interest rate policy
- Fed balance sheet
- U.S. growth relative to global growth
- Effect of 2018 tax cuts
- Effect of 2018 spending package
So far, our forecast has played out somewhat unevenly, with the dollar flat-to-higher against most currencies on a spot basis, and more mixed on a total return basis when including the carry return.
While President Trump has made no secret of the fact that he would prefer a weaker dollar to boost the global competitiveness of U.S. manufacturers and exporters, the reality is that his toolkit to unilaterally drive the dollar down is limited to three options:
- Exchange Stabilization Fund – a Treasury operated asset pool used for dollar stabilization. The fund has approximately $94B in assets so its firepower is limited
- Fed Pressure – this is already used actively, and while the Fed would assert its independence in cutting rates three times, the pressure coming from the Administration serves as a dollar sentiment headwind
- Verbal Intervention – also used actively, President Trump has referenced dollar strength in at least five tweets this year
Of course, there's always the chance we might get some form of multi-lateral accord to weaken the dollar, similar to the 1985 Plaza Accord. However, the reality is the dollar's current level of overvaluation—which is approximately 1.5 standard deviations on our PPP model—is modest compared to the 1985 event. In a world in which no one wants a stronger currency, it is unlikely that the rest of the world would consent to a systematic dollar devaluation program.
Leading Indicators
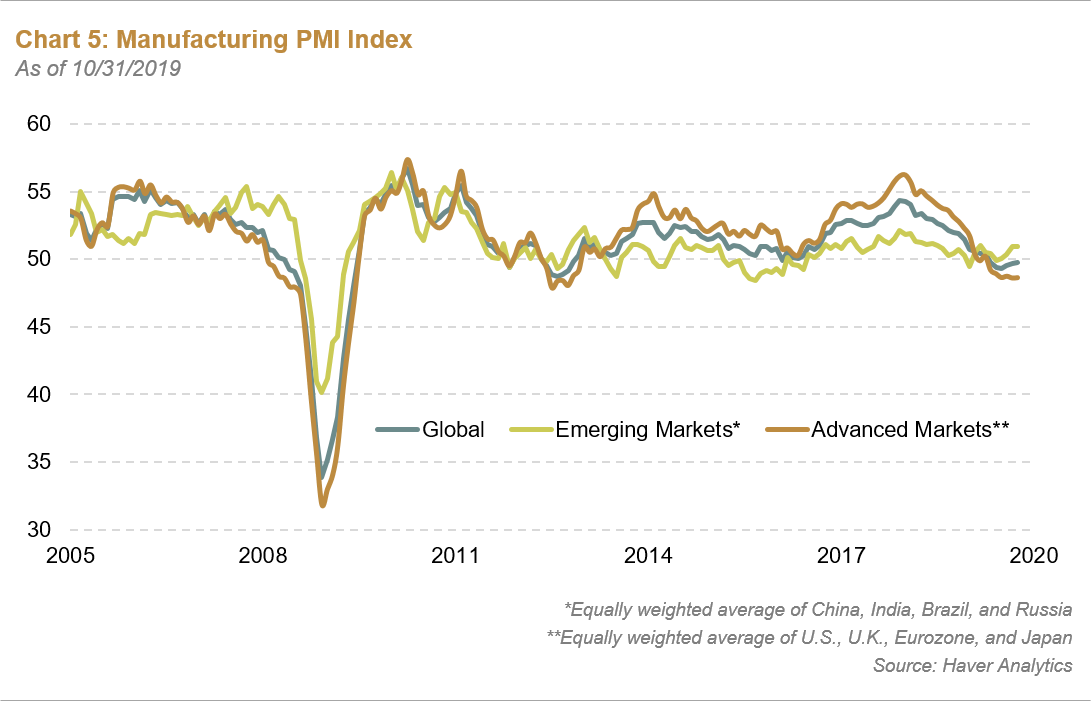
This leaves us wondering if we are wrong here or simply a quarter or two away from this easing element starting to play out alongside the others. Very recently, we have observed some improvement in data outside the U.S. that suggests the global versus U.S. growth story is starting to materialize, though it's less about the U.S. and the remaining G3 and instead more of a story around the G20 markets. A look at leading indicators and PMIs illustrates this unfolding theme, where emerging markets appear more interesting than developed markets on a forward-looking basis: 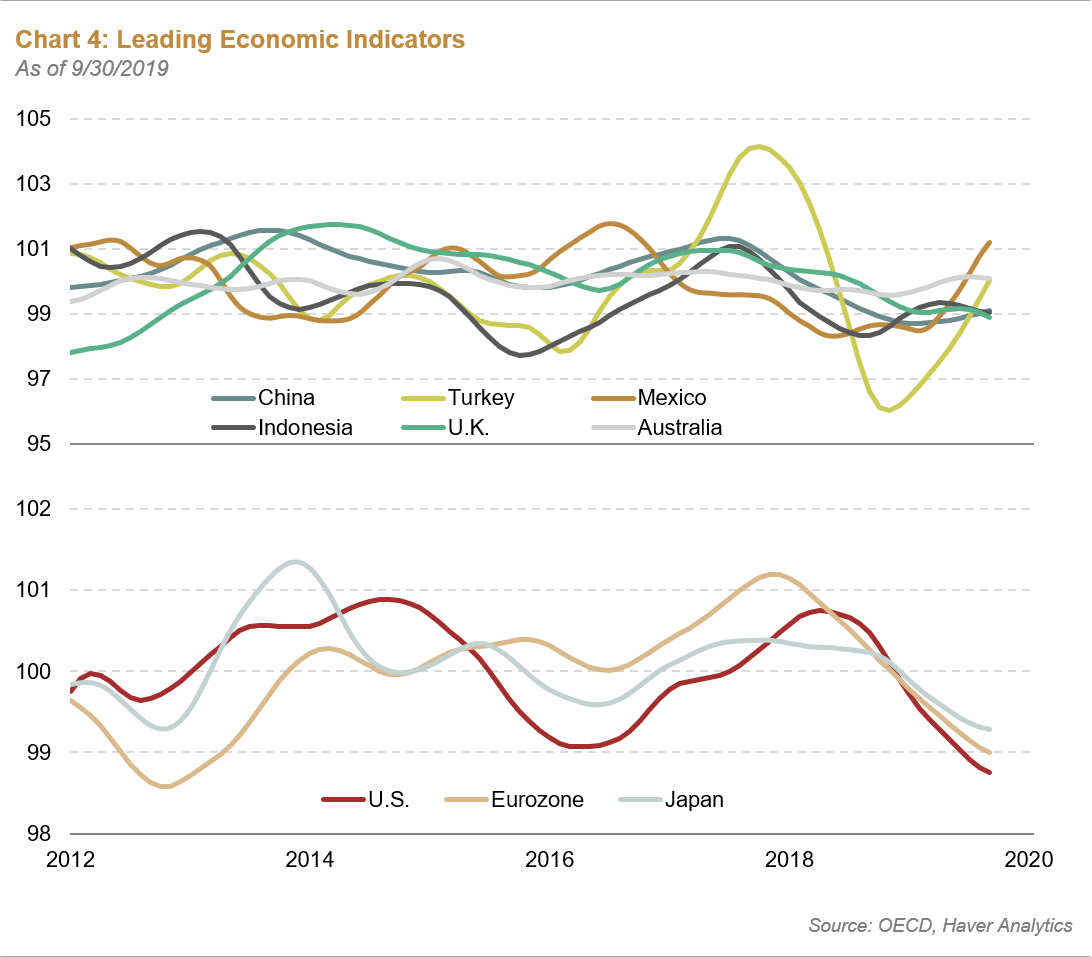
In summary, our easing thesis from earlier this year continues to unfold, although some aspects have crystallized more quickly than others. Remember that easing tends to work with a lag, so our view at this juncture is that the fruits of this easing cycle are likely to be borne in early 2020. Let's see how things unfold over the next two quarters.
Groupthink is bad, especially at investment management firms. Brandywine Global therefore takes special care to ensure our corporate culture and investment processes support the articulation of diverse viewpoints. This blog is no different. The opinions expressed by our bloggers may sometimes challenge active positioning within one or more of our strategies. Each blogger represents one market view amongst many expressed at Brandywine Global. Although individual opinions will differ, our investment process and macro outlook will remain driven by a team approach.

