


 Download PDF
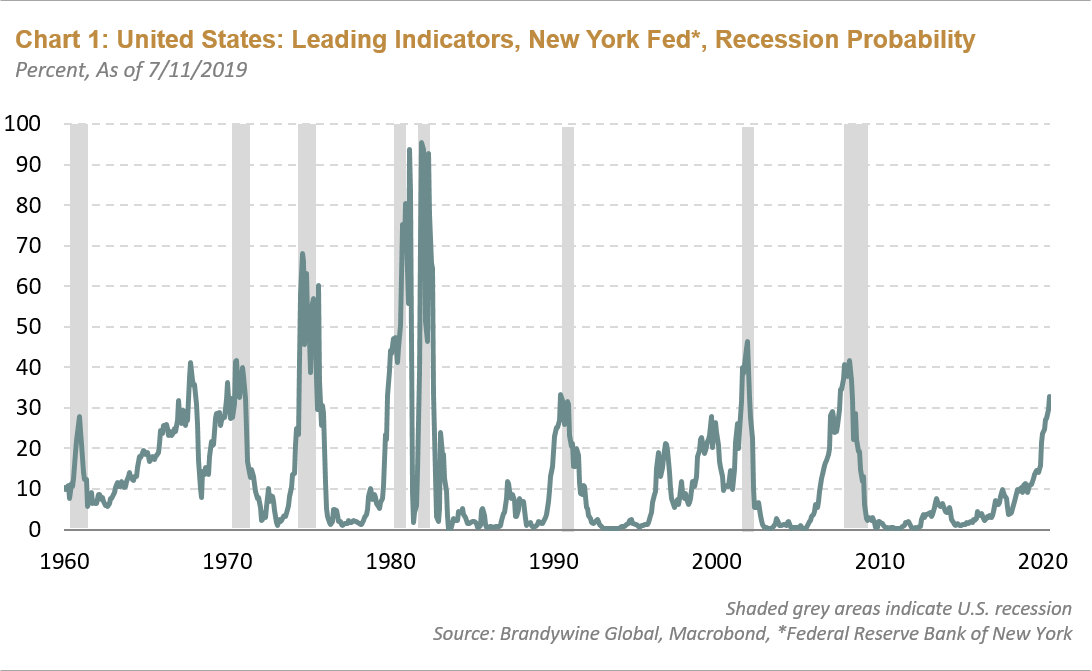
As we sit here at mid-year with the Treasury yield curve inverted, some investors are concerned about the signal value of this phenomenon—and with good cause. As Chart 1 shows, the risk of a recession has risen considerably according to the New York Federal Reserve Bank Recession Probability Indicator, which uses the yield curve slope as a primary input. Other than once in the mid-60s, every time this indicator has exceeded a 30% probability, a recession has occurred.
We have certainly spent considerable time discussing this issue but our analysis has led to the conclusion that recession remains unlikely, courtesy of a Federal Reserve (Fed) that has responded appropriately to the smoke signals being delivered by the bond market along with a weakening in PMIs, leading indicators, and confidence surveys. Furthermore, the policy shift by the Fed—the “800 pound gorilla” in the central bank universe—has paved the way for other central banks to follow. We therefore see a policy easing cycle unfolding in the second half of this year that has positive implications for the global growth cycle. We see this easing playing out in three ways:
- Policy Rates
- Central Bank Balance Sheets
- U.S. dollar
Policy Rates
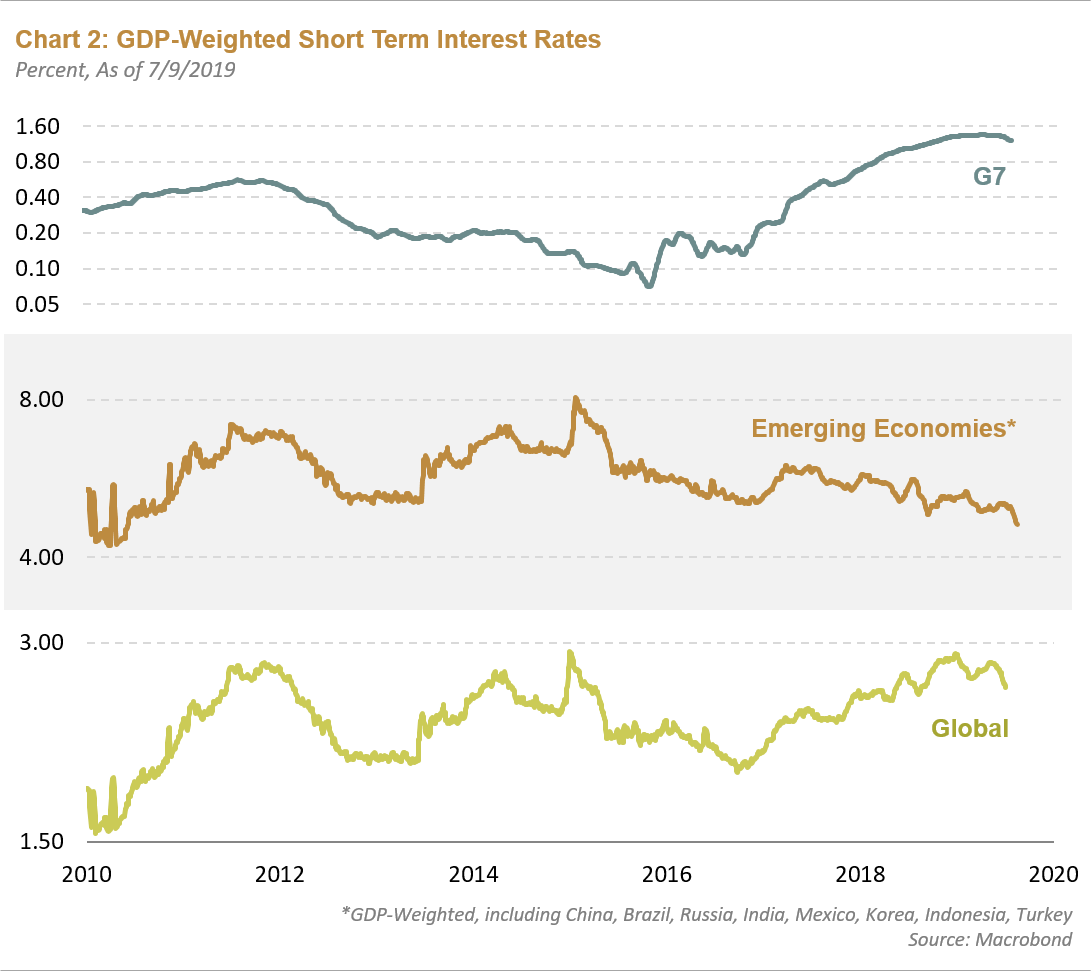
Arguably the most direct transmission method of monetary policy is central bank policy rates. Over the past three months, not only has the Fed changed its tune but the European Central Bank (ECB) has also signaled a dovish outlook, while other central banks have already begun easing cycles: Australia -50 basis points (bps), New Zealand -25bps, Malaysia -25bps, Russia -25bps. Globally, policy rates peaked at the end of 2018 and are moving lower:
Central Bank Balance Sheets
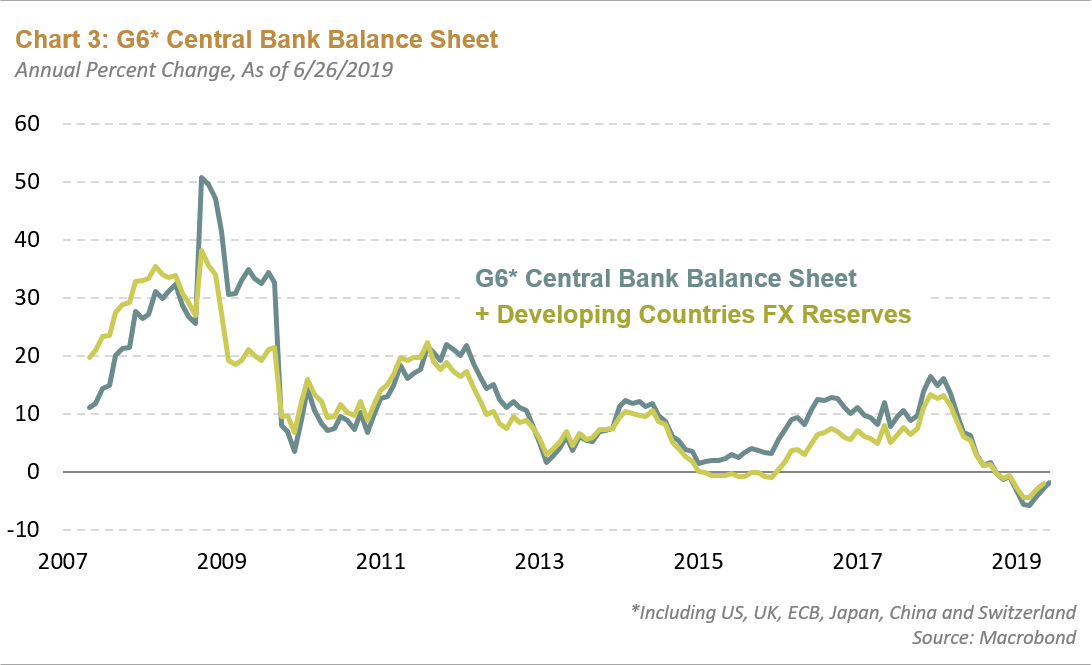
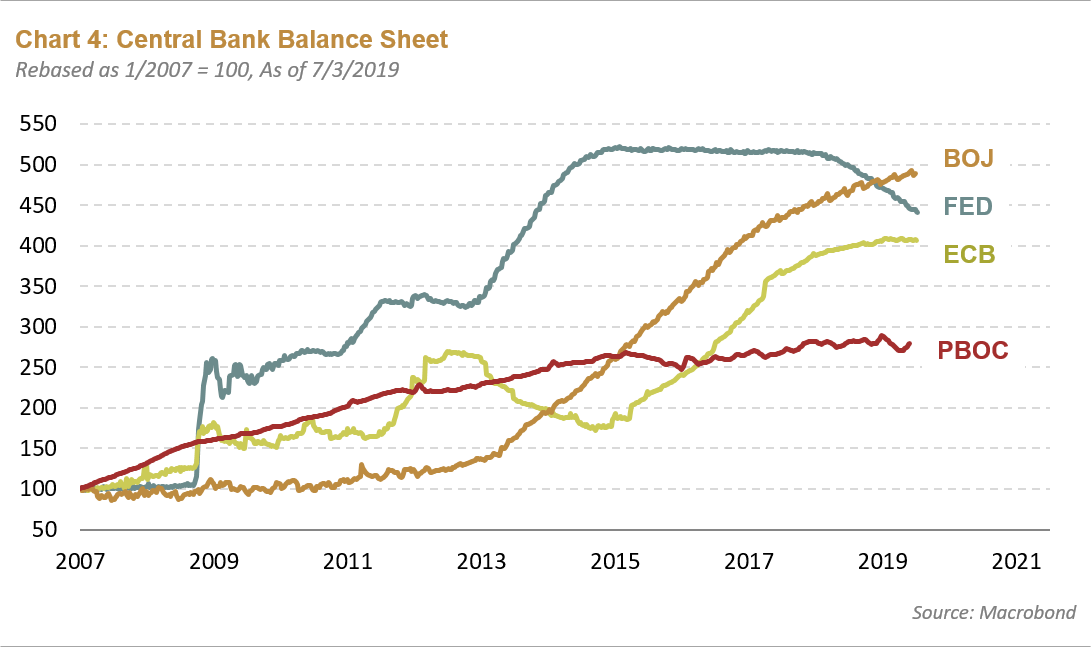
Over the past 10 years we have witnessed an unprecedented expansion in central bank balance sheets courtesy of global quantitative easing (QE). More recently, QE has ended in Europe and the U.S.—the Fed even started to reduce its balance sheet in 2018. However, recent economic weakness has prompted central banks to reassess their balance sheet management policies. We expect the Fed to end its quantitative tightening (QT) process this year and outgoing ECB President Mario Draghi recently hinted that the central bank could resume QE should economic weakness persist in the eurozone. Meanwhile, the Bank of Japan and People’s Bank of China are in easing mode already.
This means that the global composite of major central bank balance sheets has almost ceased contracting and is poised to expand again:
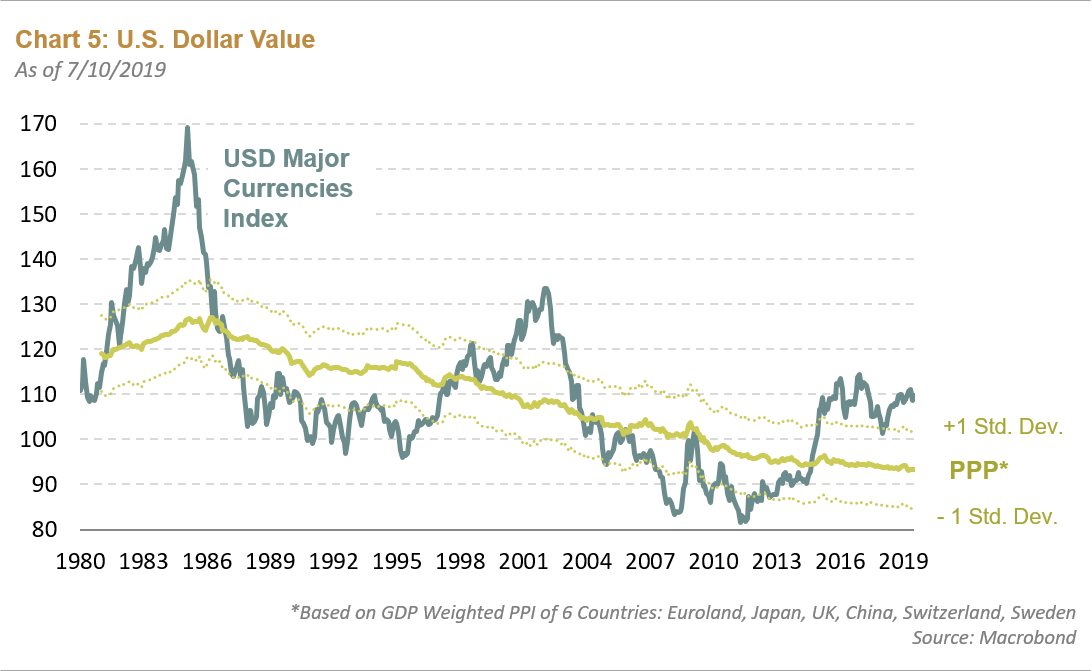
U.S. Dollar
A stable-to-weaker dollar would also represent a form of easing for other countries as it will help reduce downward pressure on their currencies, which can create a negative feedback loop through higher inflation, and in turn, higher import prices. The Fed doesn’t have the ability to automatically lower the value of the U.S. dollar but certainly through lower interest rates and a stable balance sheet the environment becomes more conducive to some dollar weakness. The Trump Administration makes no secret of its desire for the dollar to fall and provide a tailwind for U.S. exports. These factors coupled with the end of the U.S. fiscal thrust we saw in 2018 suggest to us that the dollar bull cycle may have run its course. The U.S. interest rate differential with the rest of the world should compress as domestic growth slows while growth in the rest of world picks up.
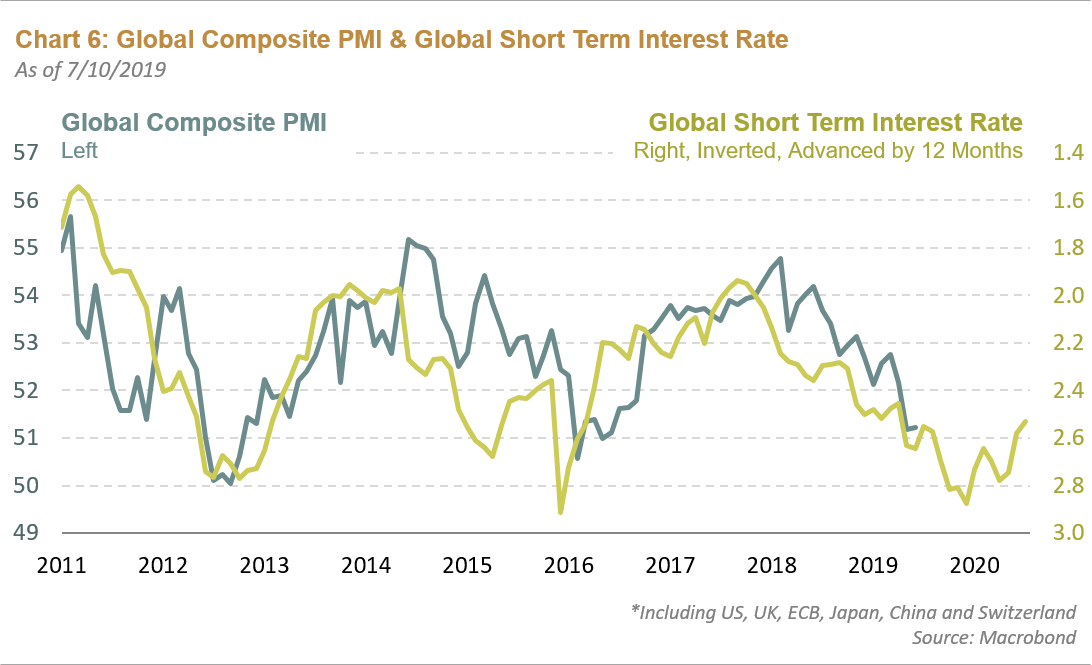
Looking at the historical relationship between policy rates and the economy, it is evident to us that the easing cycle should create a more constructive environment for the global economy over the next 12 months. Of the three anticipated forms of easing outlined earlier, there is a strong correlation between the trajectory of short-term rates and global PMI composites as well. With many central banks set to ease or already doing so, a rebound in global PMIs should follow, which would be a highly constructive development for the global economy and risk assets—a reason why we are positioned where the global economy is going to be.
Groupthink is bad, especially at investment management firms. Brandywine Global therefore takes special care to ensure our corporate culture and investment processes support the articulation of diverse viewpoints. This blog is no different. The opinions expressed by our bloggers may sometimes challenge active positioning within one or more of our strategies. Each blogger represents one market view amongst many expressed at Brandywine Global. Although individual opinions will differ, our investment process and macro outlook will remain driven by a team approach.

