

 Download PDF
Exacerbated by the recent banking crisis, sentiment around commercial real estate (CRE) has turned so weak that these assets are almost perceived to be uninvestible. However, the CRE market has been no stranger to distress since the Global Financial Crisis (GFC). First, e-commerce triggered a retail property crisis. Next, office properties, which were previously considered safer investments than retail, fell victim to the working-from-home trend brought on by the COVID pandemic. Here, we identify the financial markets’ major exposures to CRE property, especially the office sector, look through the refinance maturity wall, gauge potential losses in commercial mortgage-backed securities (CMBS), and assess the investment implications.
CRE Fundamentals: Office Is the New Epicenter
The total CRE market is valued at over $10 trillion, with office being the largest sector at 24.2%, according to Morgan Stanley data. Given its size and special challenges, the office sector is at the center of the challenges facing CRE.
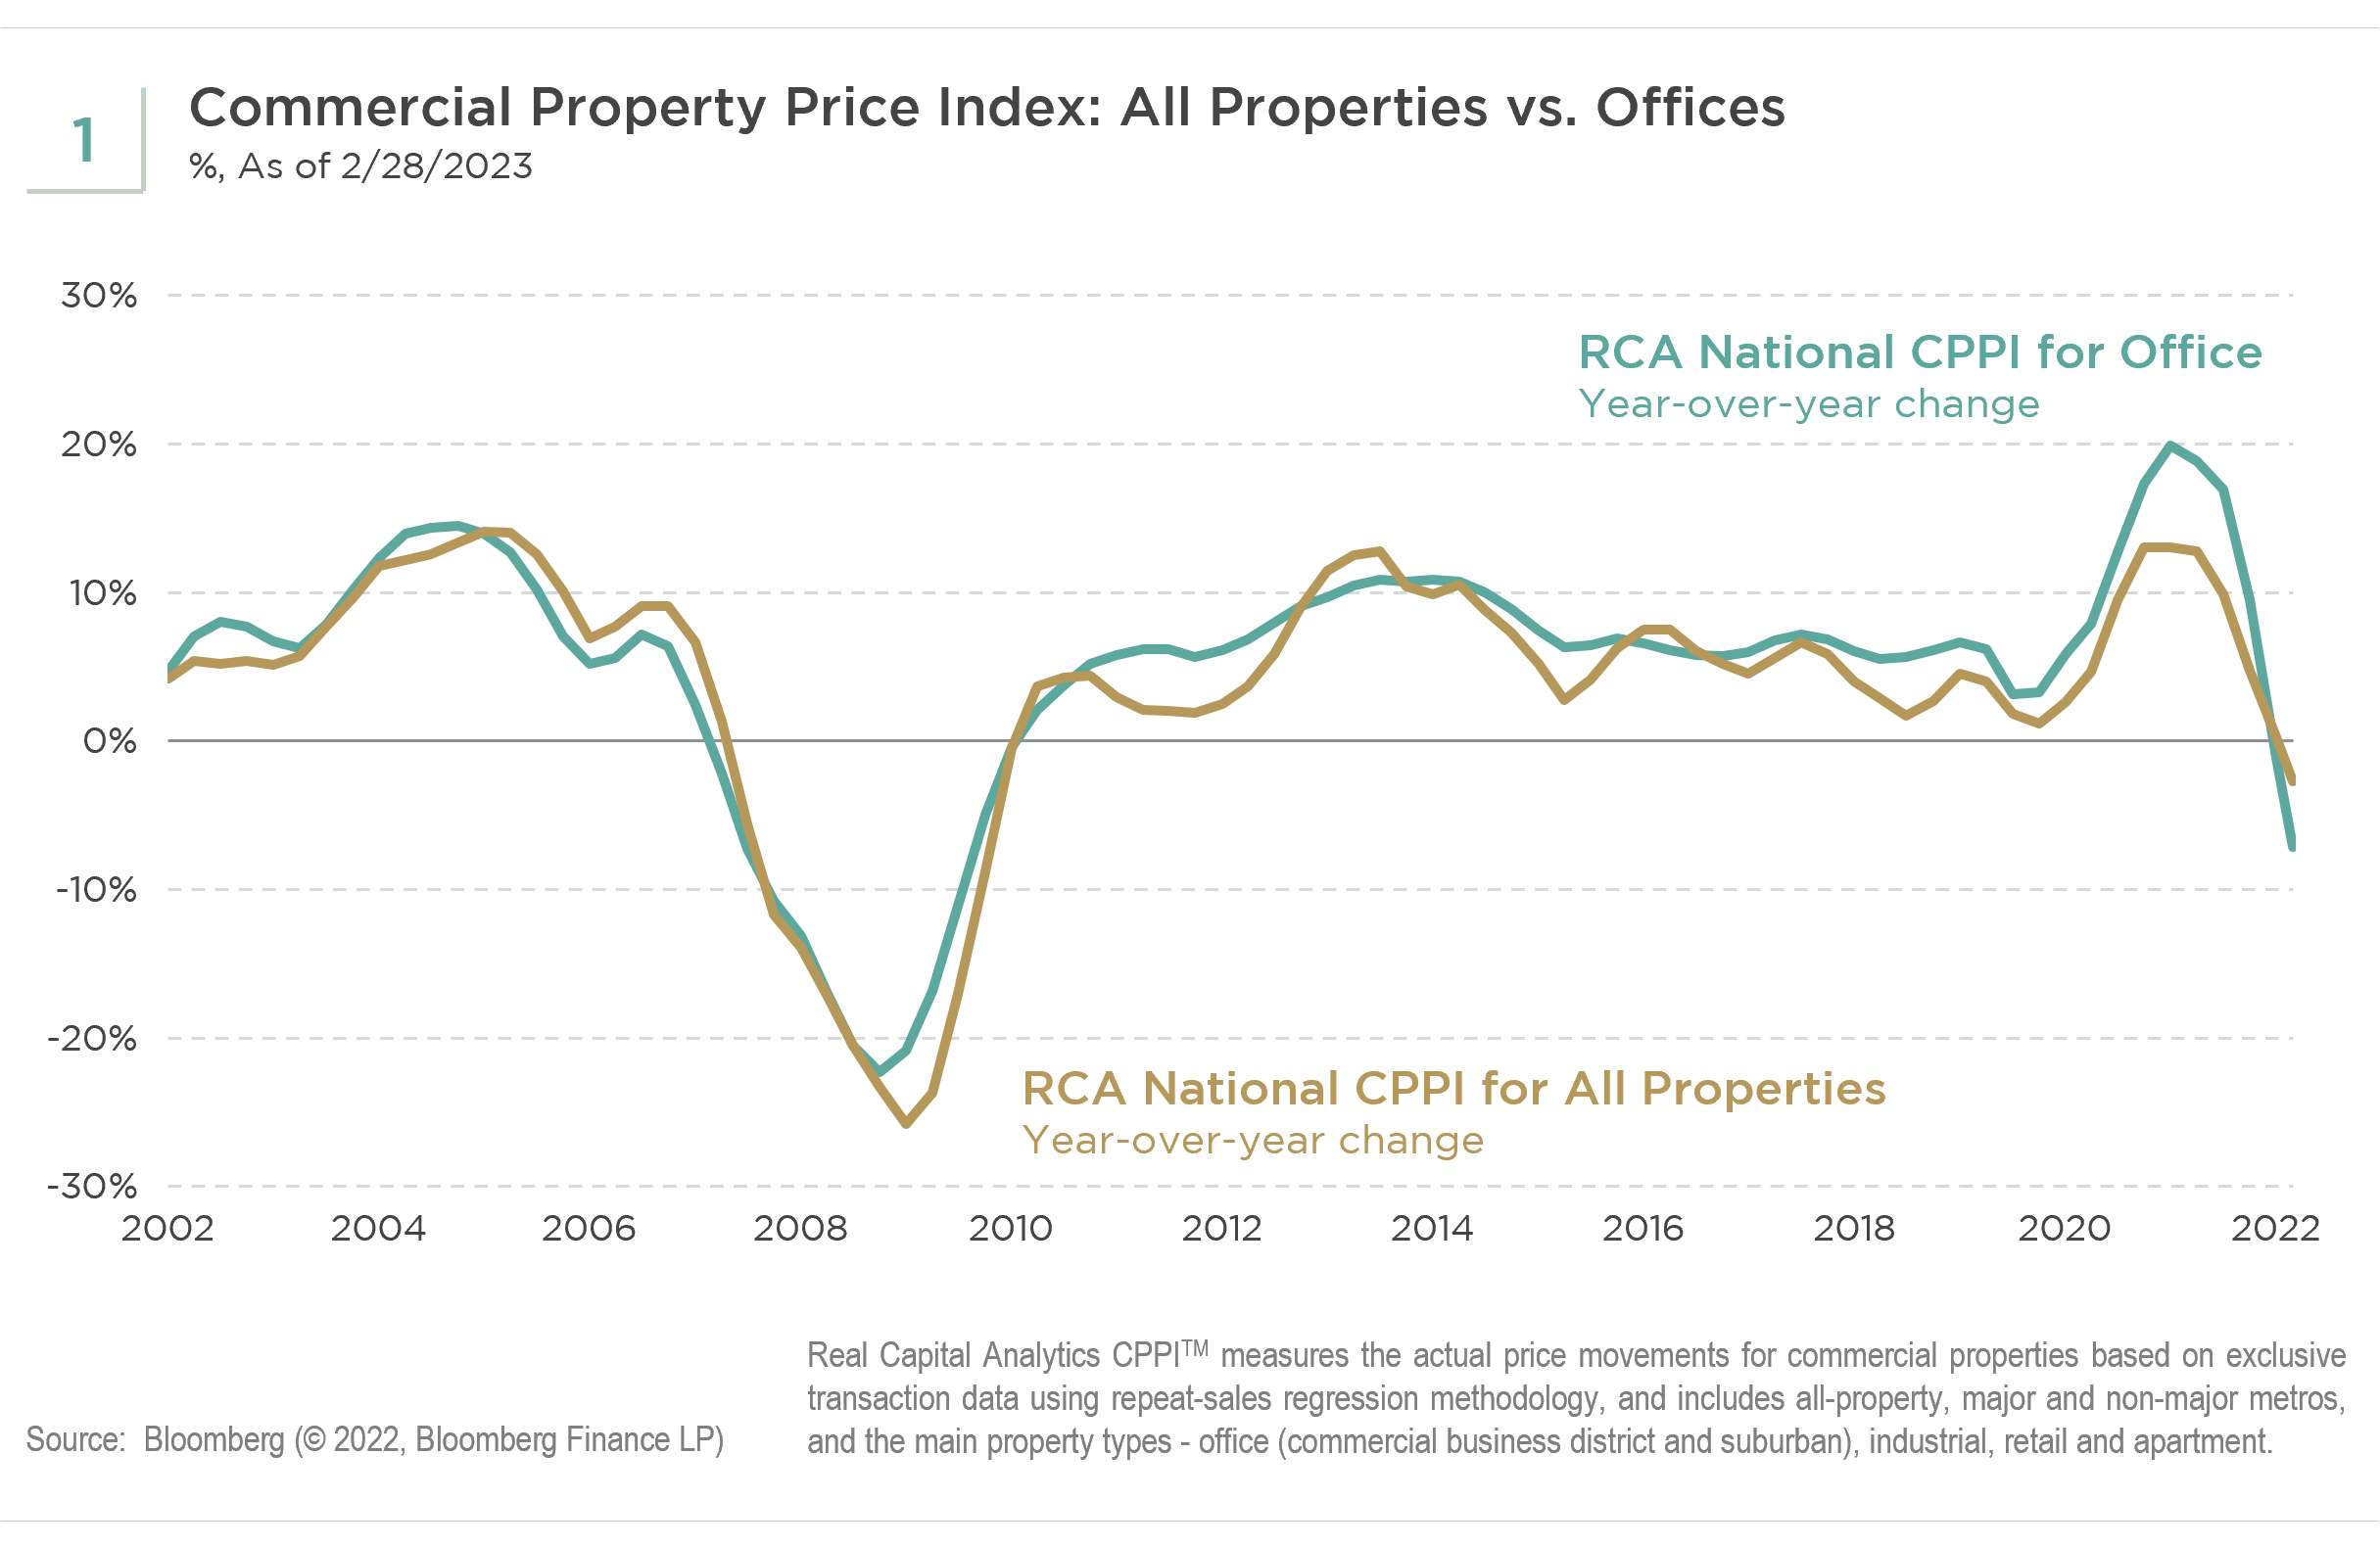
1. Negative Price Growth
After a fragile recovery from the March 2020 bottom, the office market has begun to reprice to the new regime of higher interest rates and challenging office fundamentals, which reflect a return-to-office renormalization of only half pre-COVID levels. This repricing has been slow amid low transaction volumes due to wide bid and ask spreads, resulting in poor price discovery. However, lack of distressed sales and the potential of money on the sidelines may mitigate a sharp price drop. Not surprisingly, CMBS new issuance volume has frozen since the recent banking stress. According to the Real Capital Analytics Commercial Property Price Index, the year-over-year price growth in the office market turned negative in 2022, which likely will continue in the foreseeable future (see Exhibit 1).
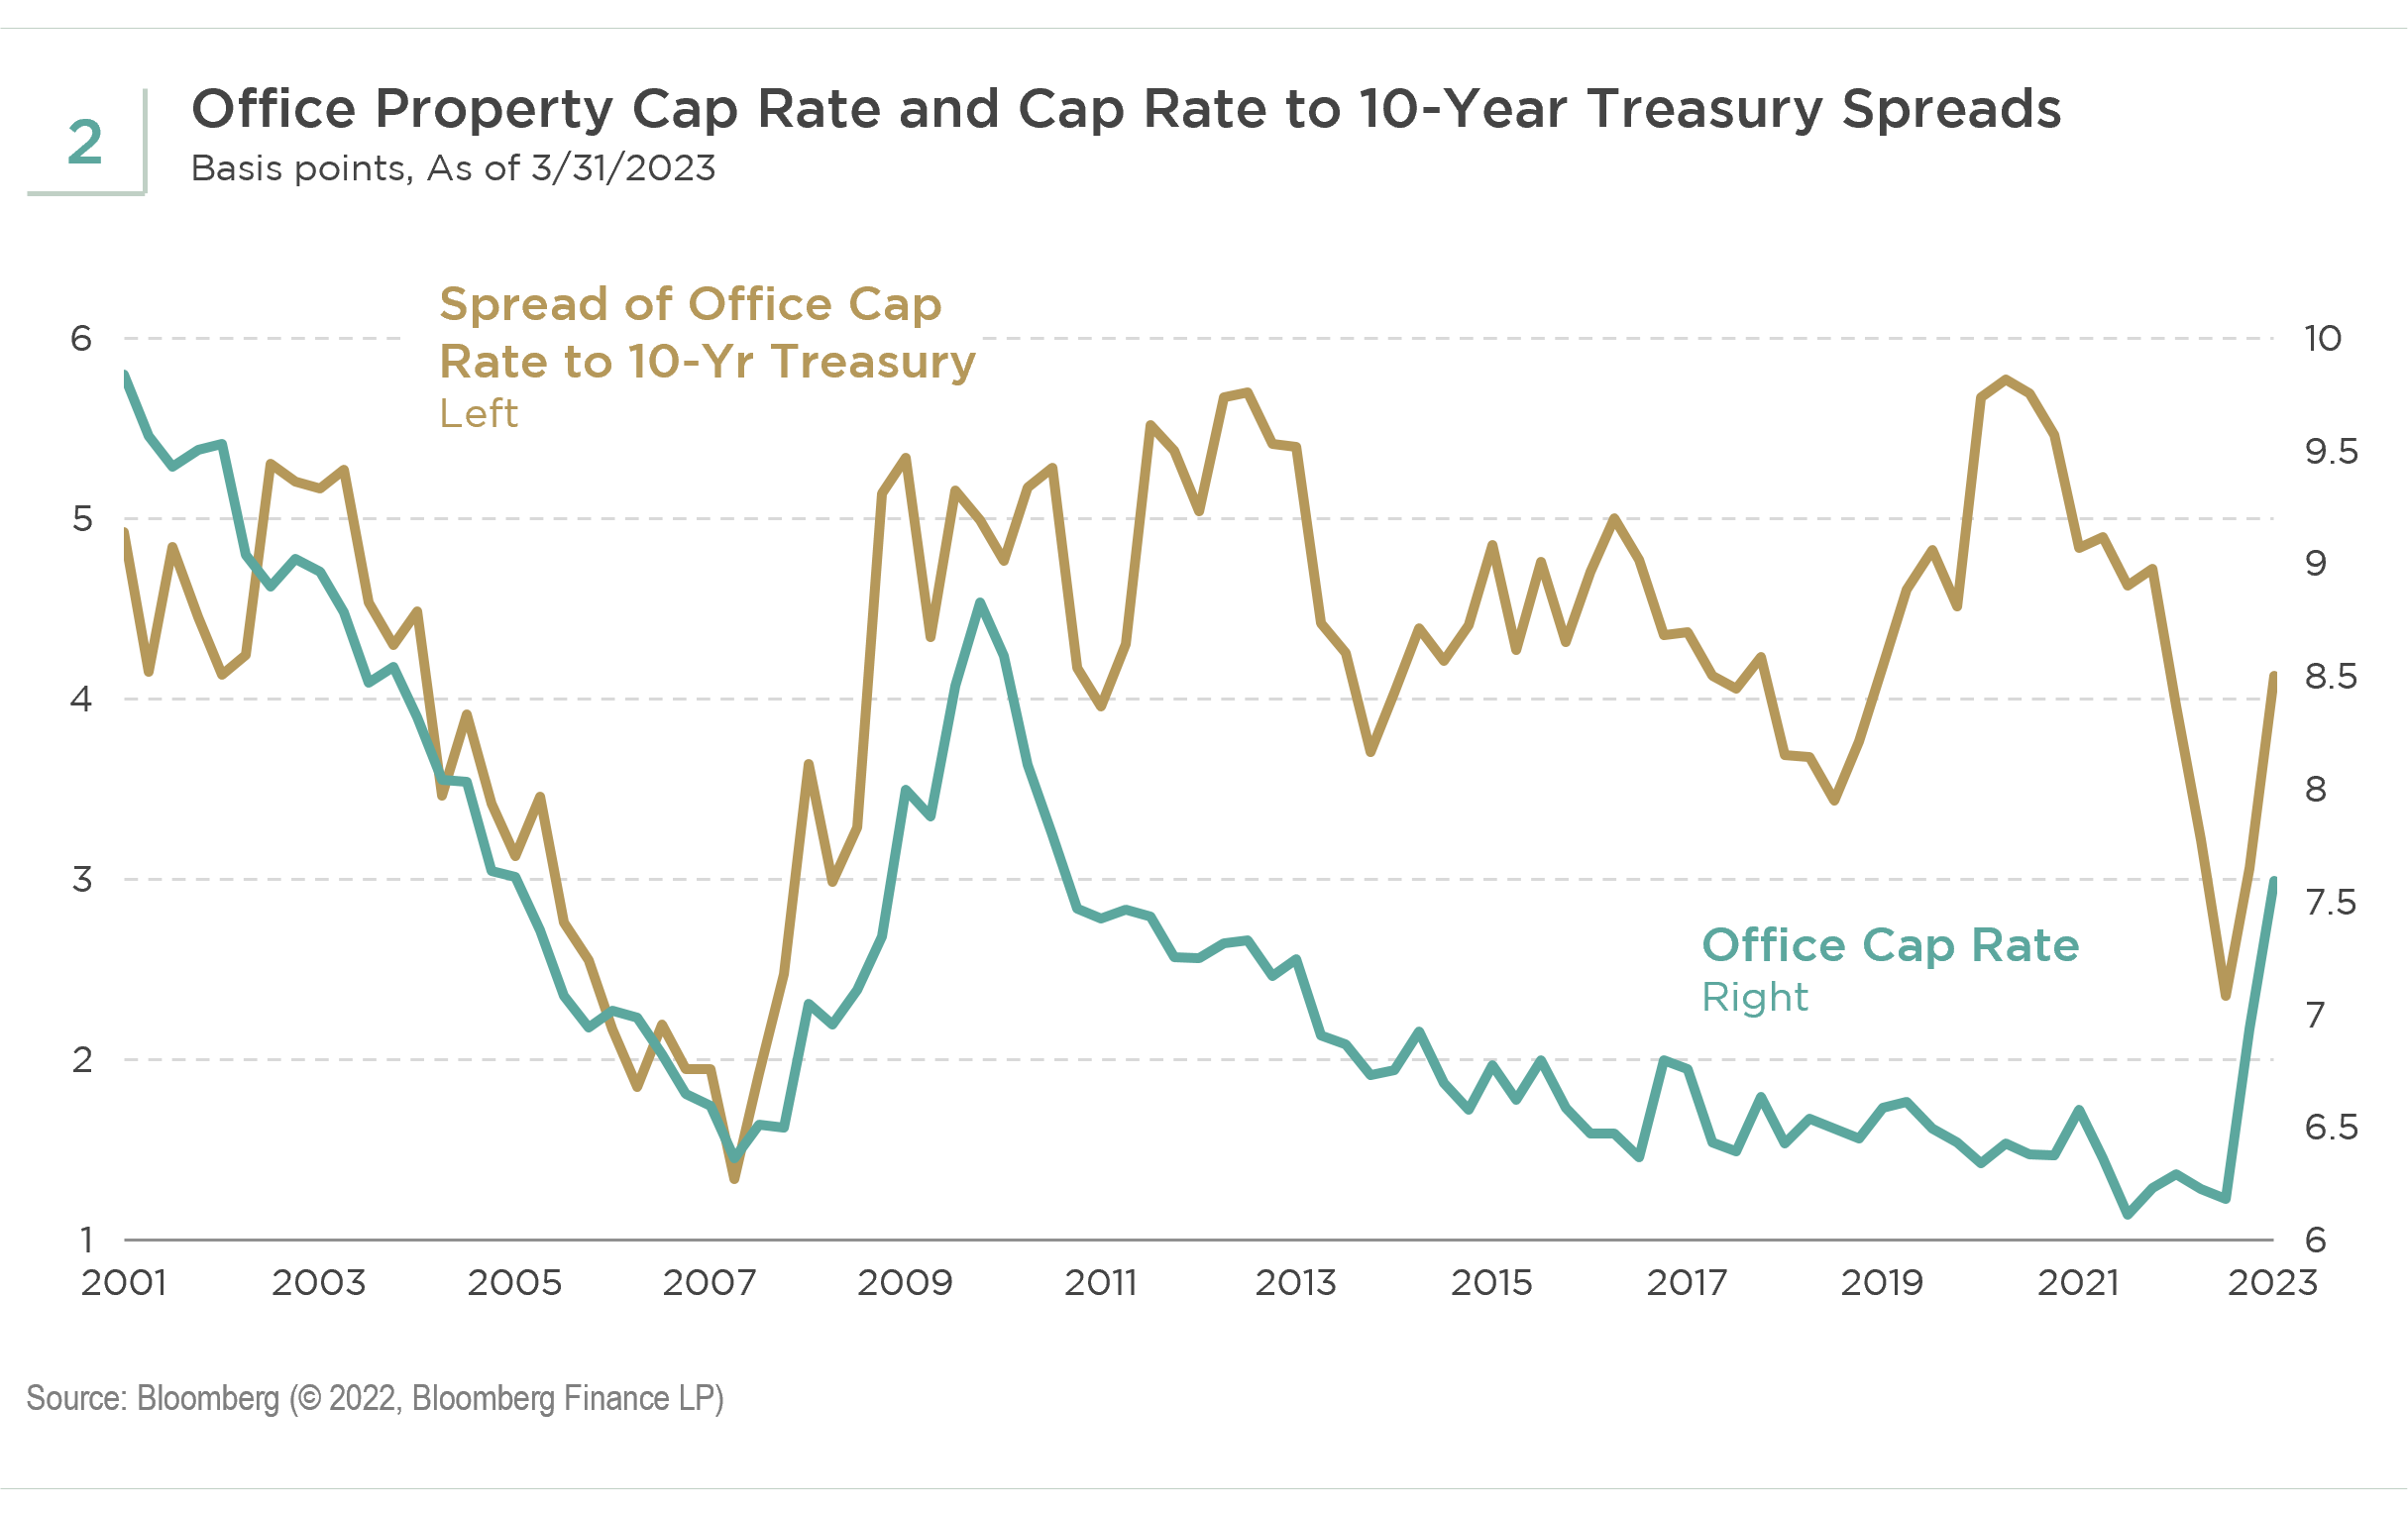
2. Spread Widening Expected
Office cap rates are slowly widening to around 7.6%, but spreads to Treasuries still look tight at 400 basis points (bps). Given the likelihood of additional economic stresses, we expect further widening ahead (see Exhibit 2).
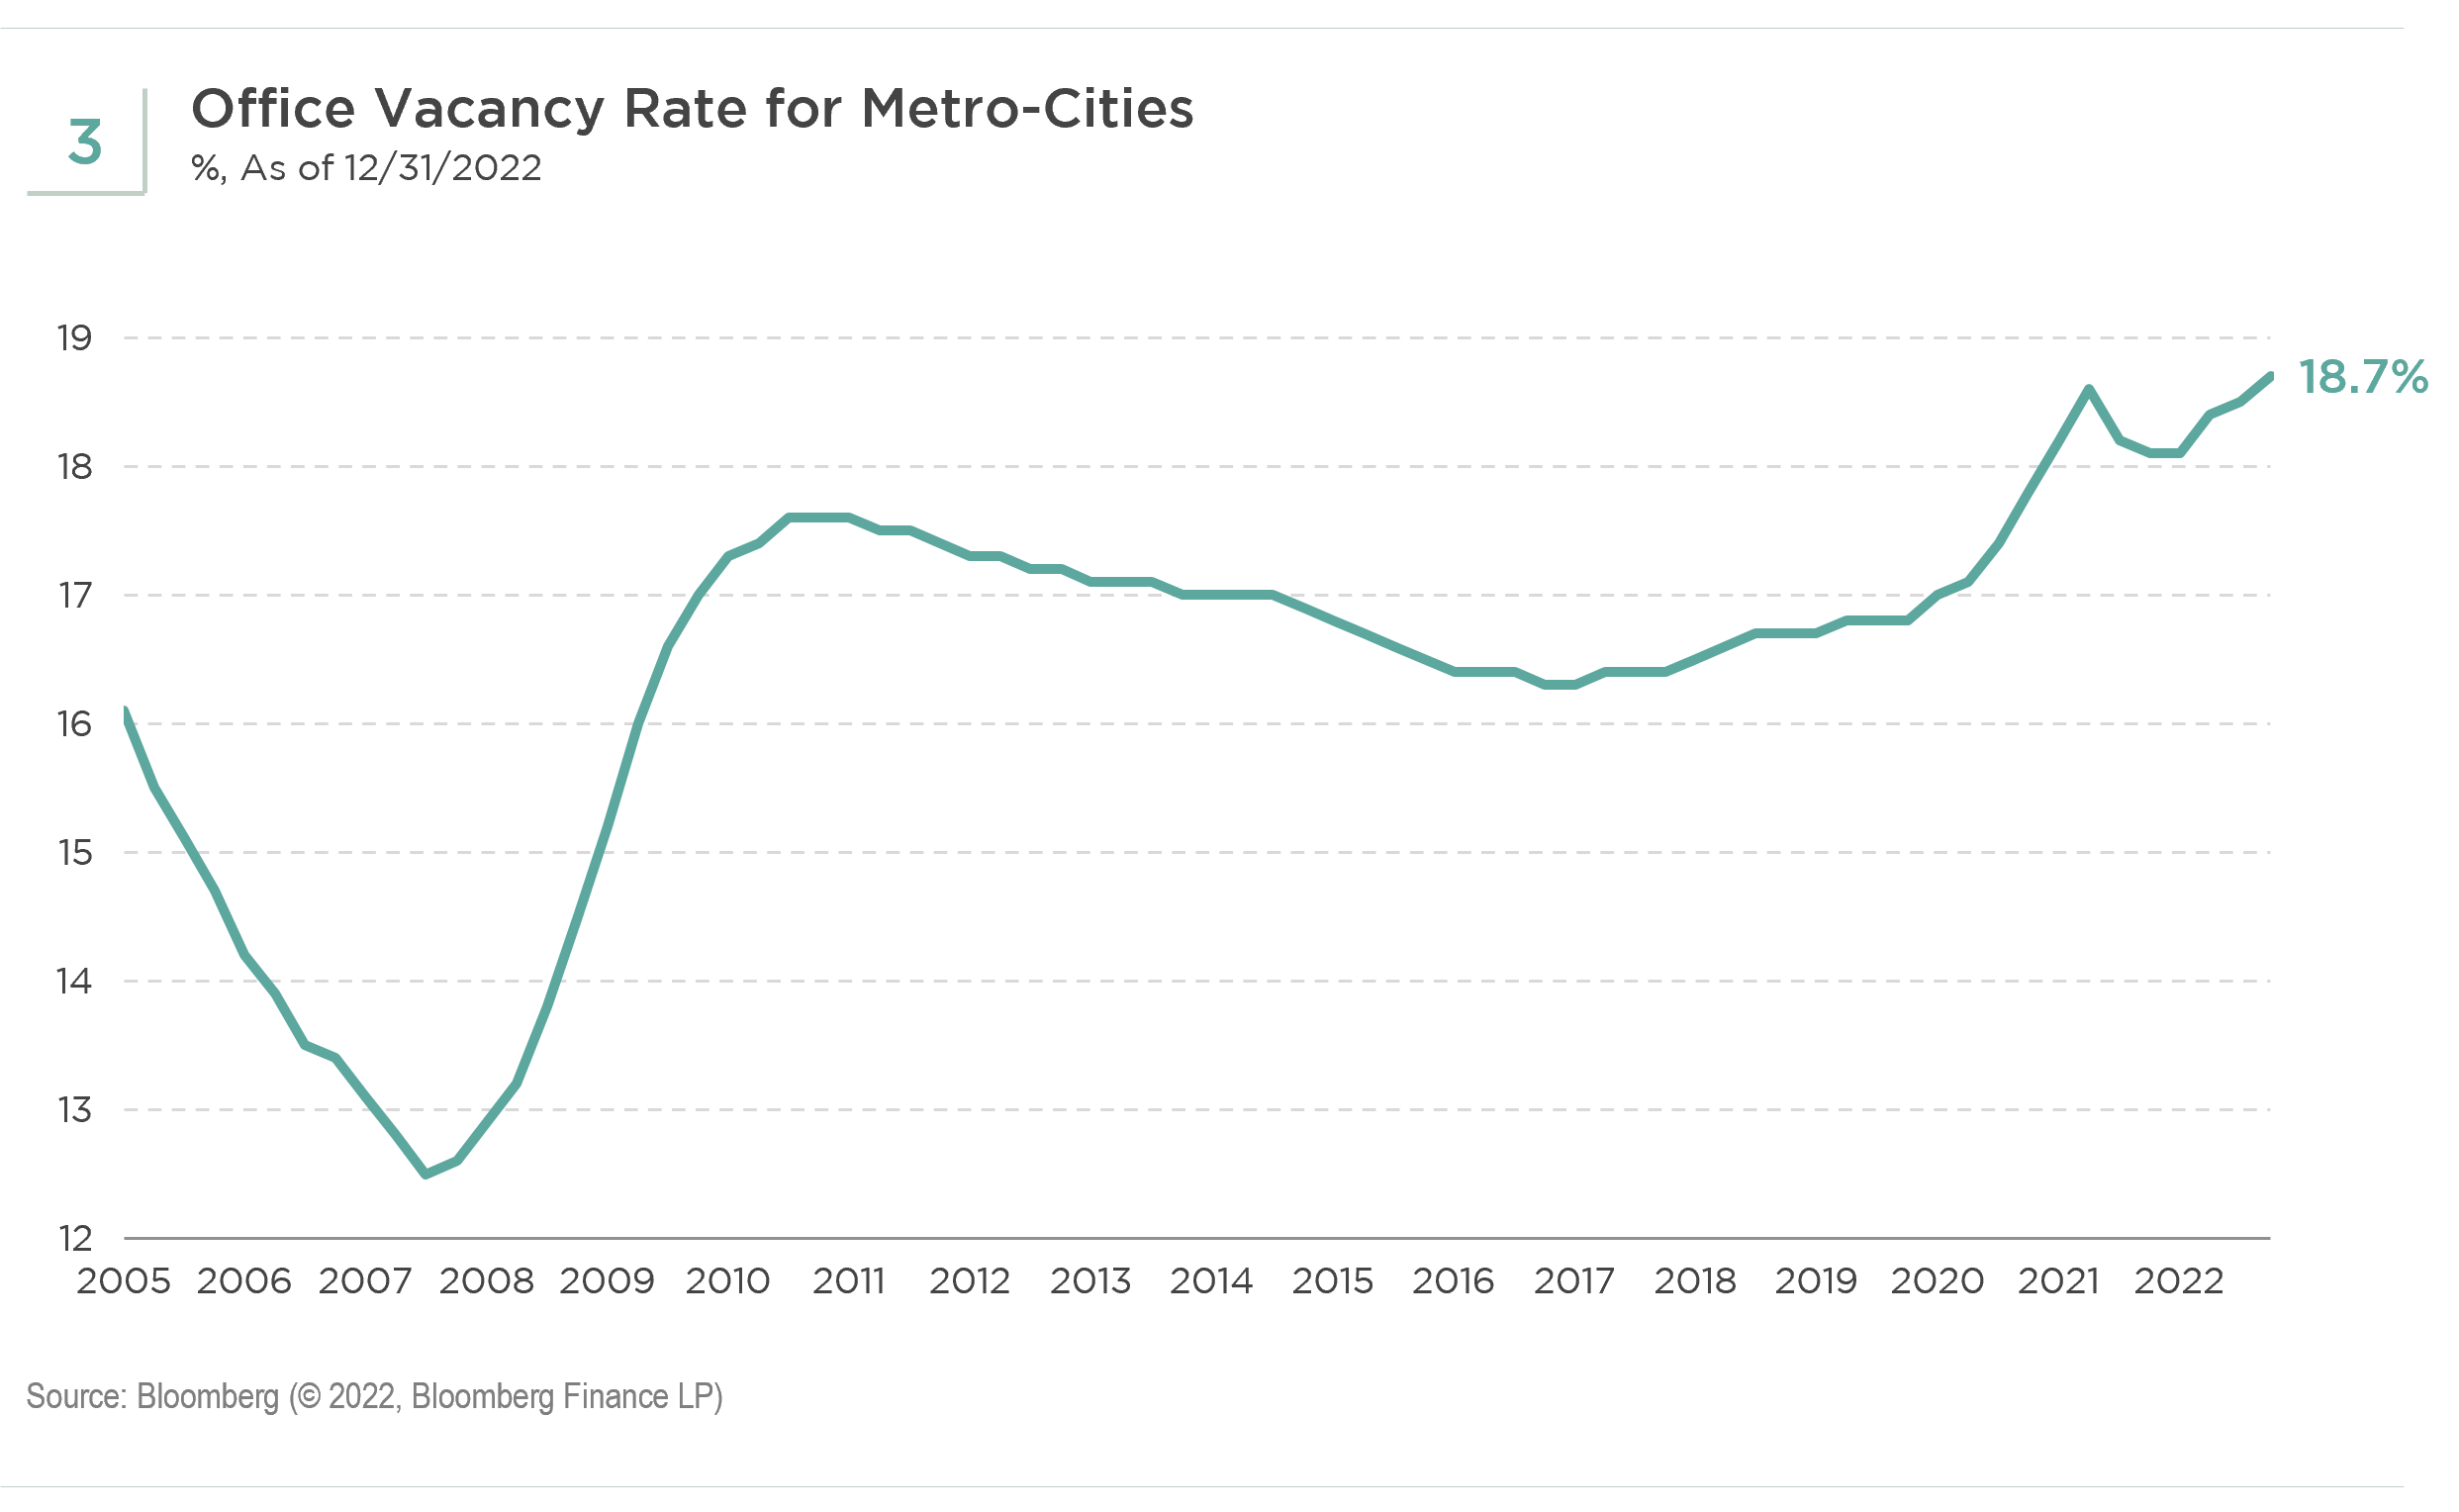
3. High Vacancy Rates
The national office vacancy rate for metro cities continues to increase, reaching 18.7% at the end of 2022 (see Exhibit 3).
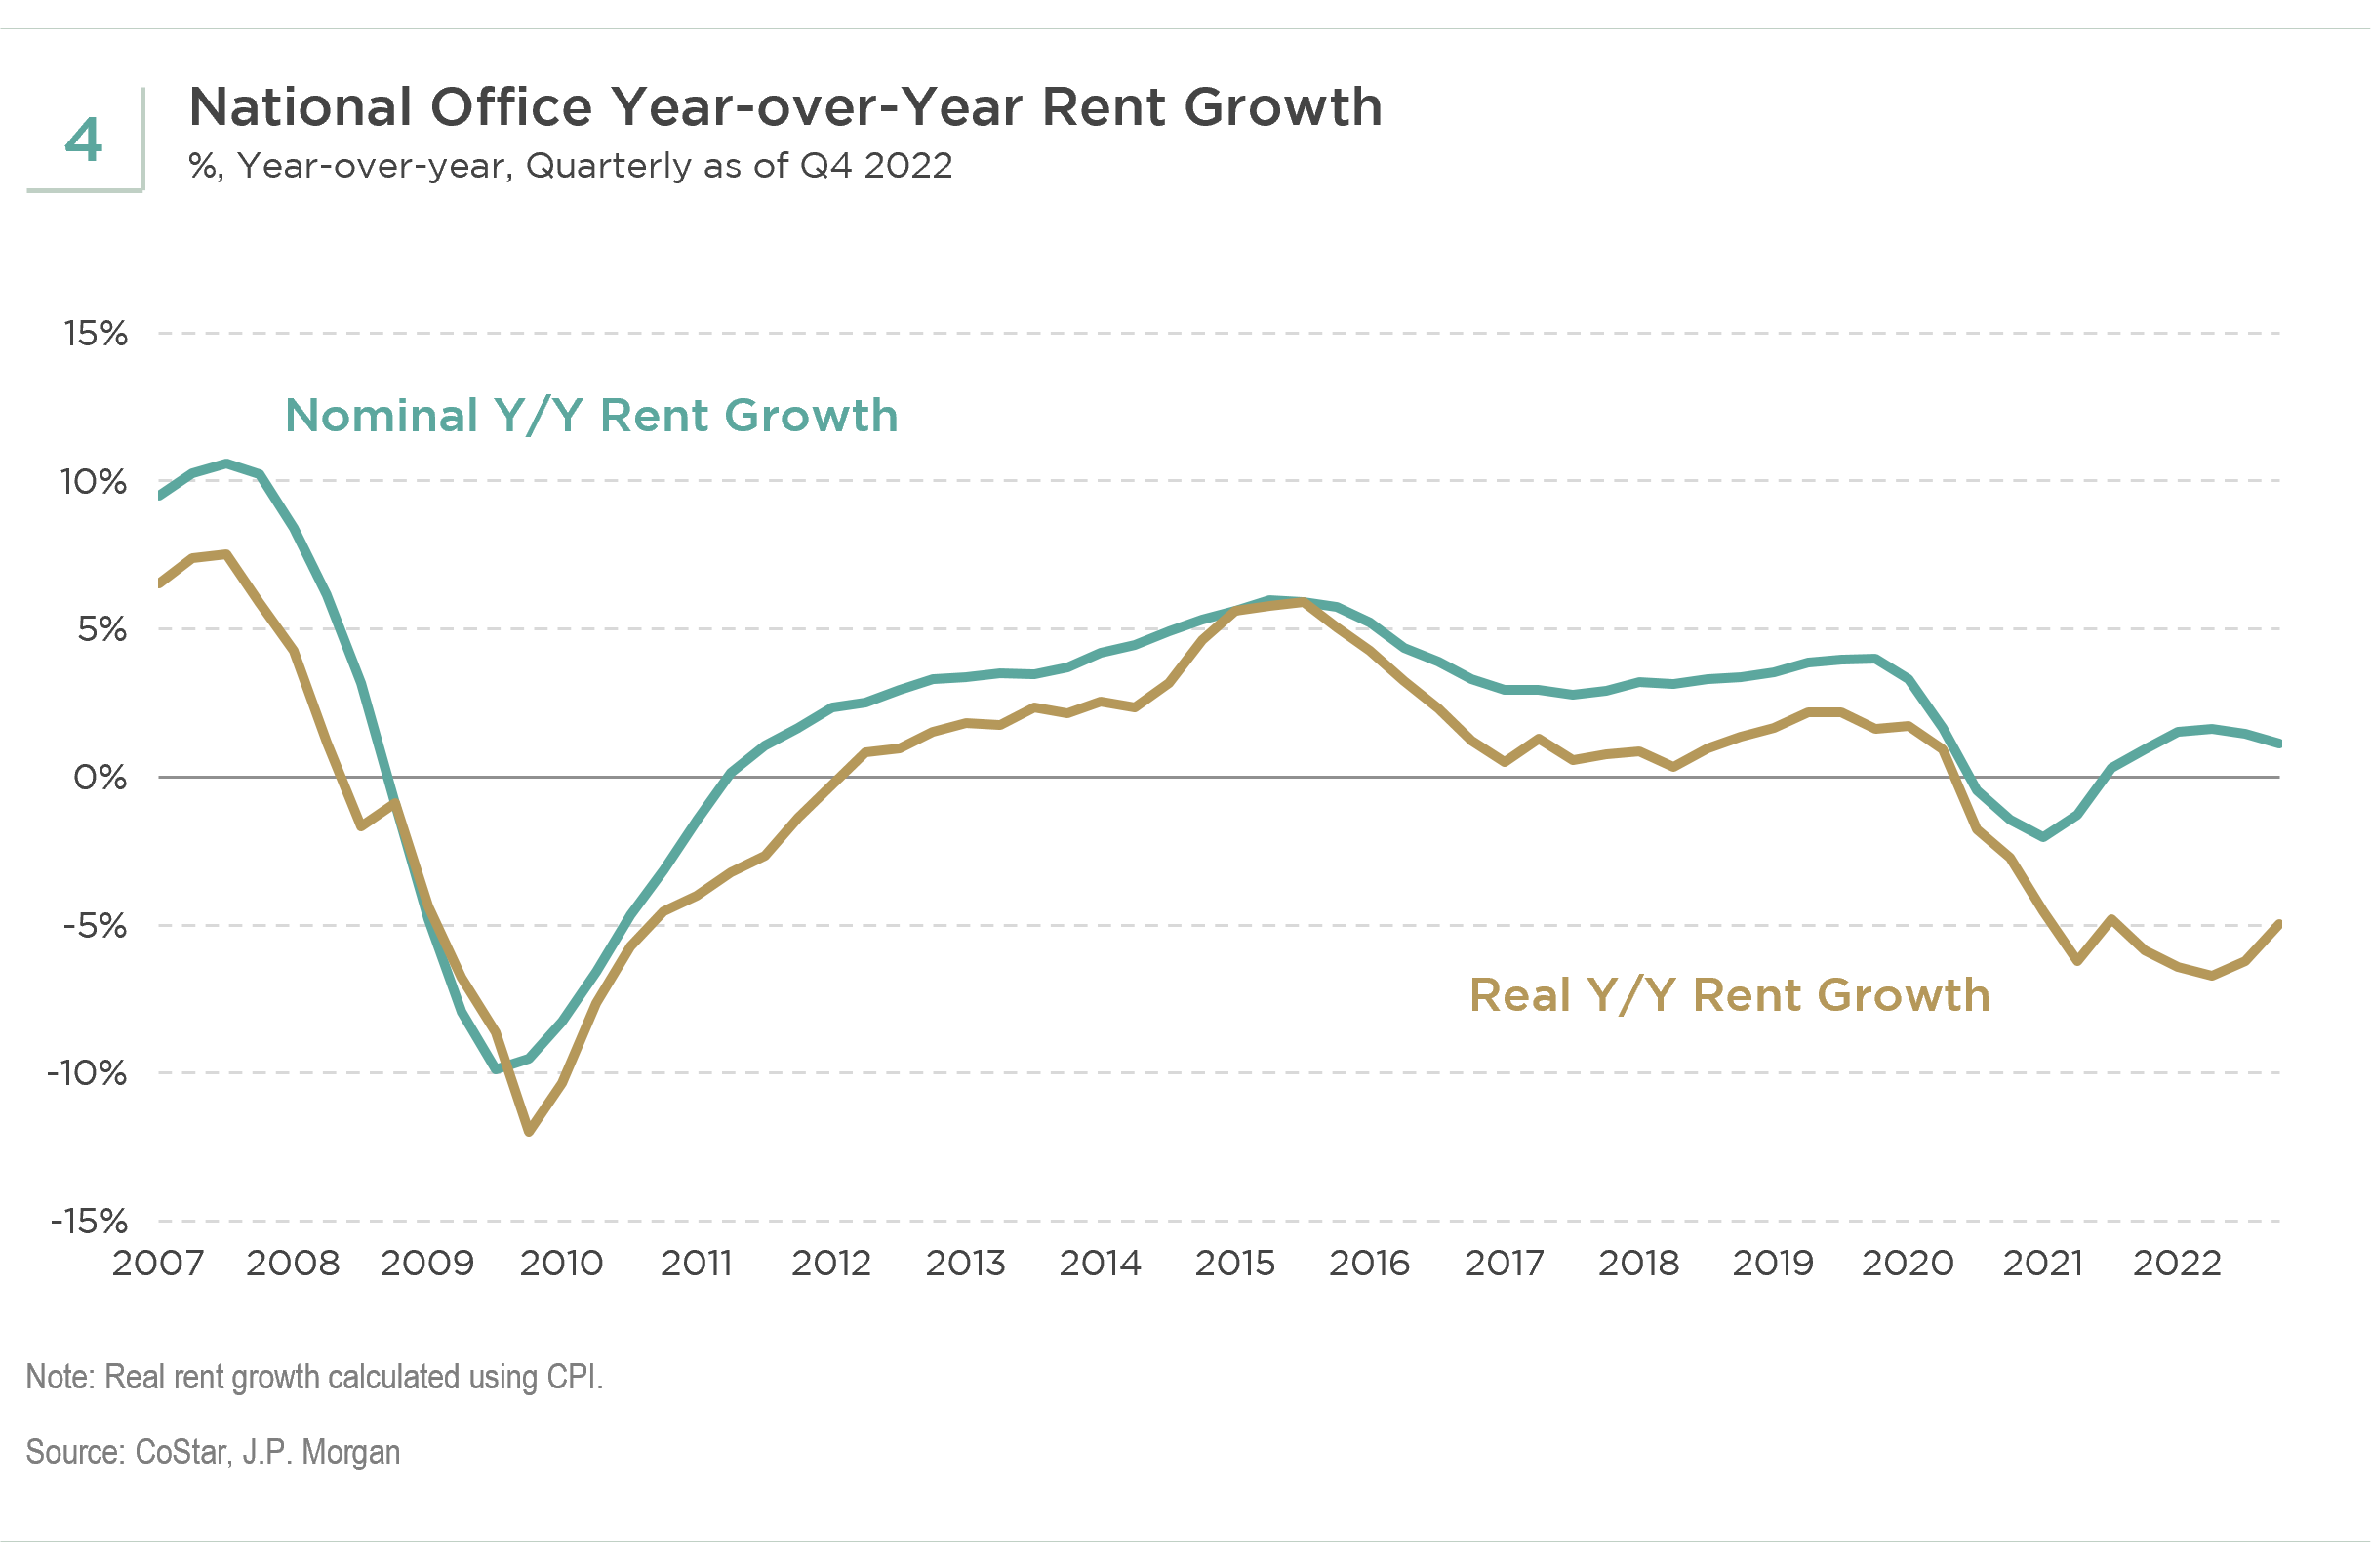
4. Falling Rents
Meanwhile, real rent growth for the office sector has been negative since 2020 (see Exhibit 4).
Who Lends to the CRE Market?
According to the Mortgage Bankers Association data, the total size of CRE debt is around $4.5 trillion (see Exhibit 5). We also are facing a maturity wall of close to $1 trillion in CRE loans maturing by the end of 2024, according to Bloomberg data. Bank lending accounts for 38% of the outstanding CRE debt, with the majority held by regional banks. Government-sponsored enterprises (GSEs) are the next largest lenders, holding about 21% of the outstanding debt, concentrated in multi-family.
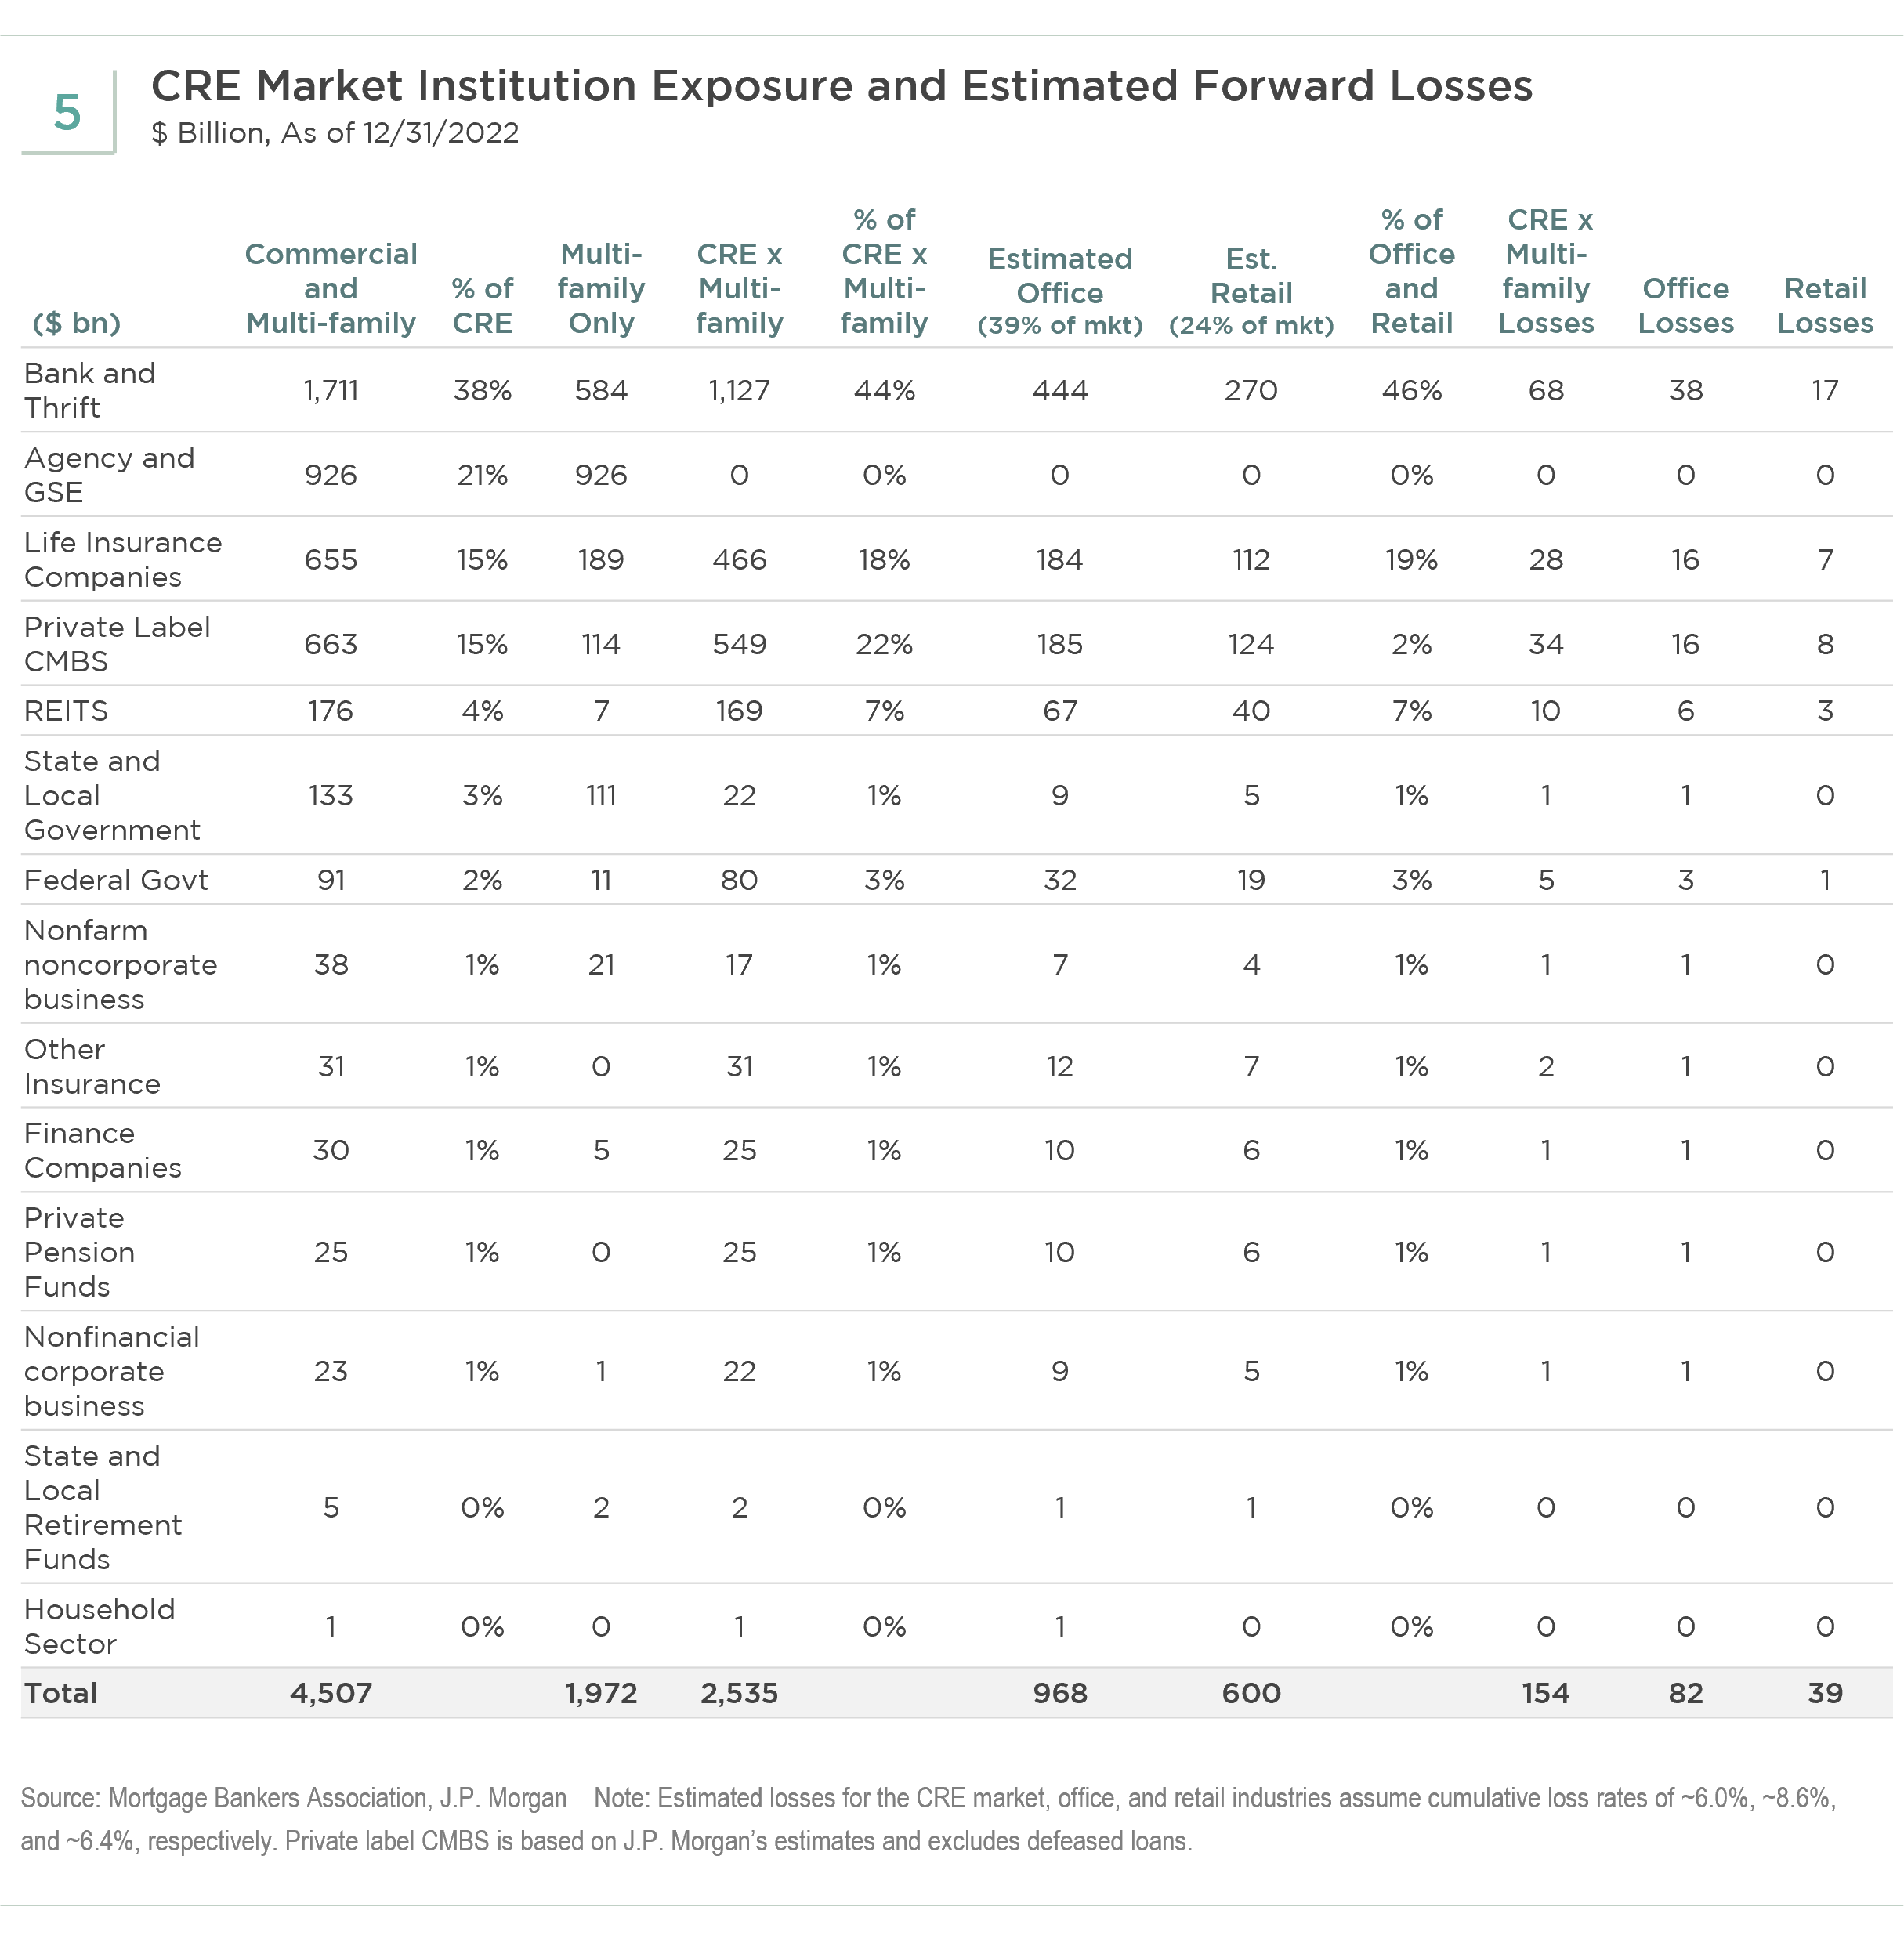
Banks’ Risky Exposures Likely to Impact New Financing
The primary concern on banks’ CRE loan book is the exposure to the office and retail sectors. Exhibit 5 estimates banks’ CRE lending financed 46% of office and retail loans, roughly $714 billion. Added to this concern is the concentration of CRE loans on the balance sheets of regional banks. According to Bank of America data, out of the banks’ CRE loan book, regional banks hold about 65% of non-multifamily CRE loans. We believe the challenging performance of office and retail properties is likely to weaken regional bank earnings.
If smaller regional banks are forced to pull back, who steps in to fill the void in lending? Large banks or insurance companies are unlikely candidates. We also do not think that CMBS can absorb the excess since credit spreads are very wide under current market conditions, and private-label CMBS issuance was down about 80% in the first quarter of 2023 year over year. Some loans will go to private credit investors, but they require a higher cost of capital. As a result, borrowers will find it difficult and expensive to obtain new financing.
Refinancing Challenges for CMBS
CMBS accounts for 20% of the office and retail loans, around $310 billion (see Exhibit 5), with about $15 billion in office loans maturing in 2023 and roughly $22 billion in 2024, no small amount but probably relatively manageable. What is concerning, however, is that among office loans that are coming due in 2023, Bank of America research showed that about 95% are backed by Class B and Class C offices. Class A, B, and C categorizations are based on the quality, location, and vintage of the office buildings, with Class A the top quality and Class C the bottom. The weaker funding position of lower-quality buildings could heighten the risk of strategic default.
Office is the largest collateral type in private-label CMBS, totaling $185bn (see Exhibit 5). So far, there is no observable stress as the 60-day-plus delinquency rate is only about 2.9%, according to Deutsche Bank research. However, the percentage of office loans in special servicing is creeping higher due to refinancing challenges. We believe there will be more stress to come in the CMBS market, driven by office loans given the shift to work-from-home and hybrid work arrangements.
Despite these concerns, we do not expect many liquidations. Instead, we expect to see loan extensions, modifications, debt restructurings, and similar trends. While these modifications will take time to play out, ultimately how these problem loans are resolved will depend on the idiosyncratic condition of the properties, the economic condition of their locations, and the interest rate environment down the road.
Life Insurers and GSEs Face Less Risk
Life insurers are major investors in CRE debt, lending to 19% of the office and retail CRE debt market (Exhibit 5). These investments are generally higher-quality investment grade bonds, largely characterized by low loan-to-value ratios (LTV), high debt service coverage ratios (DSCR), fixed rates, longer-term holdings, and stabilized properties with low foreclosure rates. Therefore, there are likely lower relative losses. While cashflow issues have triggered the bank runs we have seen over the past several weeks, insurance companies face no such issue.
GSEs account for 21% of CRE debt market, exclusively lending to the multi-family sector. Even though we have seen price renormalization, this sector has been performing well and does not pose much risk for now.
Saving Grace: Solid Underwriting
CRE lending has been quite conservative post-GFC, compared to 2007 when pro-forma estimates pushed LTVs over 100%. The average underwritten LTVs have been relatively conservative at just 57% for office loans, according to JP Morgan research. Their research also puts DSCRs at 2.2 times, despite some erosion recently. Borrowers have a lot of equity plus subordination in CMBS deal structures. Debt yields generally are in the double-digits, which means that for the most part they can support higher interest costs. Office property prices have about doubled since the GFC lows, indicating considerable deleveraging for seasoned loans.
Cheap Valuations: The Gravitational Pull
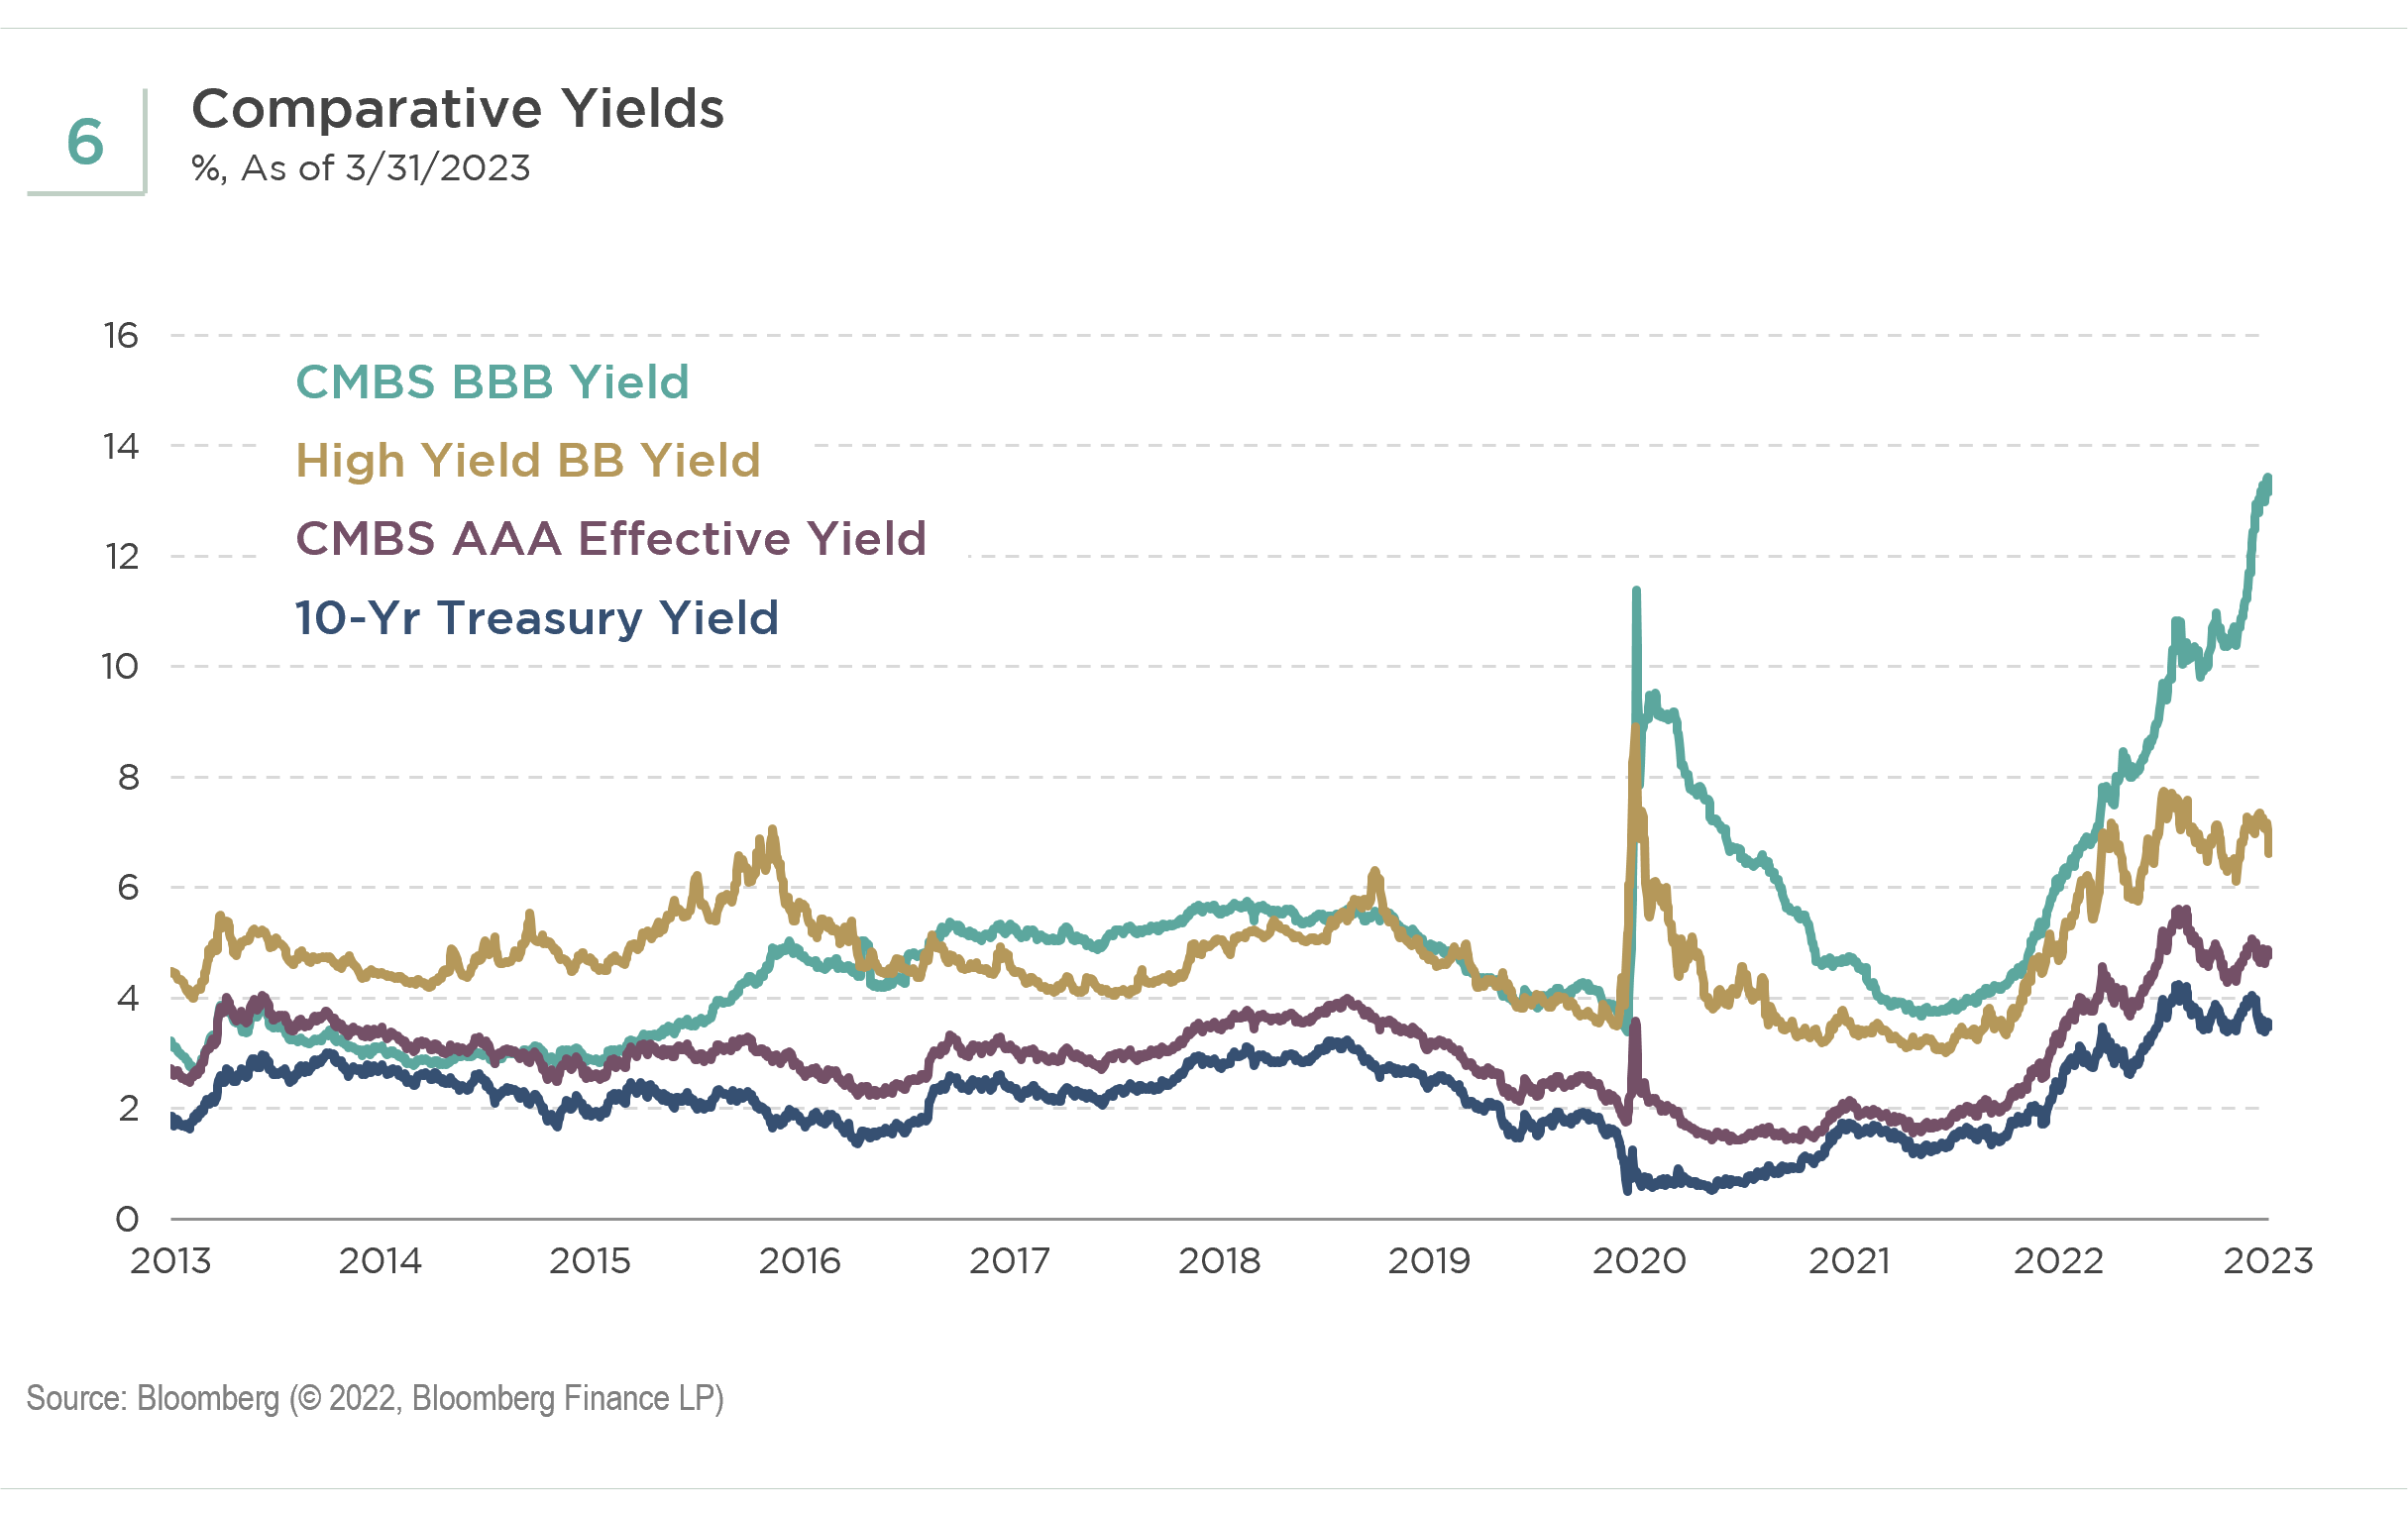
The seismic tremors rippling through office property fundamentals triggered acute steepening of the CMBS/CMBX credit curve. The sharp widening of spreads for tranches rated BBB and below is extraordinary (see Exhibit 6), both relative to 10-year Treasuries, AAA tranches, and high yield BB-rated corporate credit. We are likely to see further repricing, spread widening, and credit curve steepening over the medium term given the difficulties in refinancing and in pricing the credit risks with certainty. Cap rates also will reprice higher from here. Yields are starting to look attractive across the capital structure, especially the BBB tranches with double-digit yields. We believe it is only a matter of time until the distressed credit buyers flock to this space.
Estimating Losses and Mitigating Factors
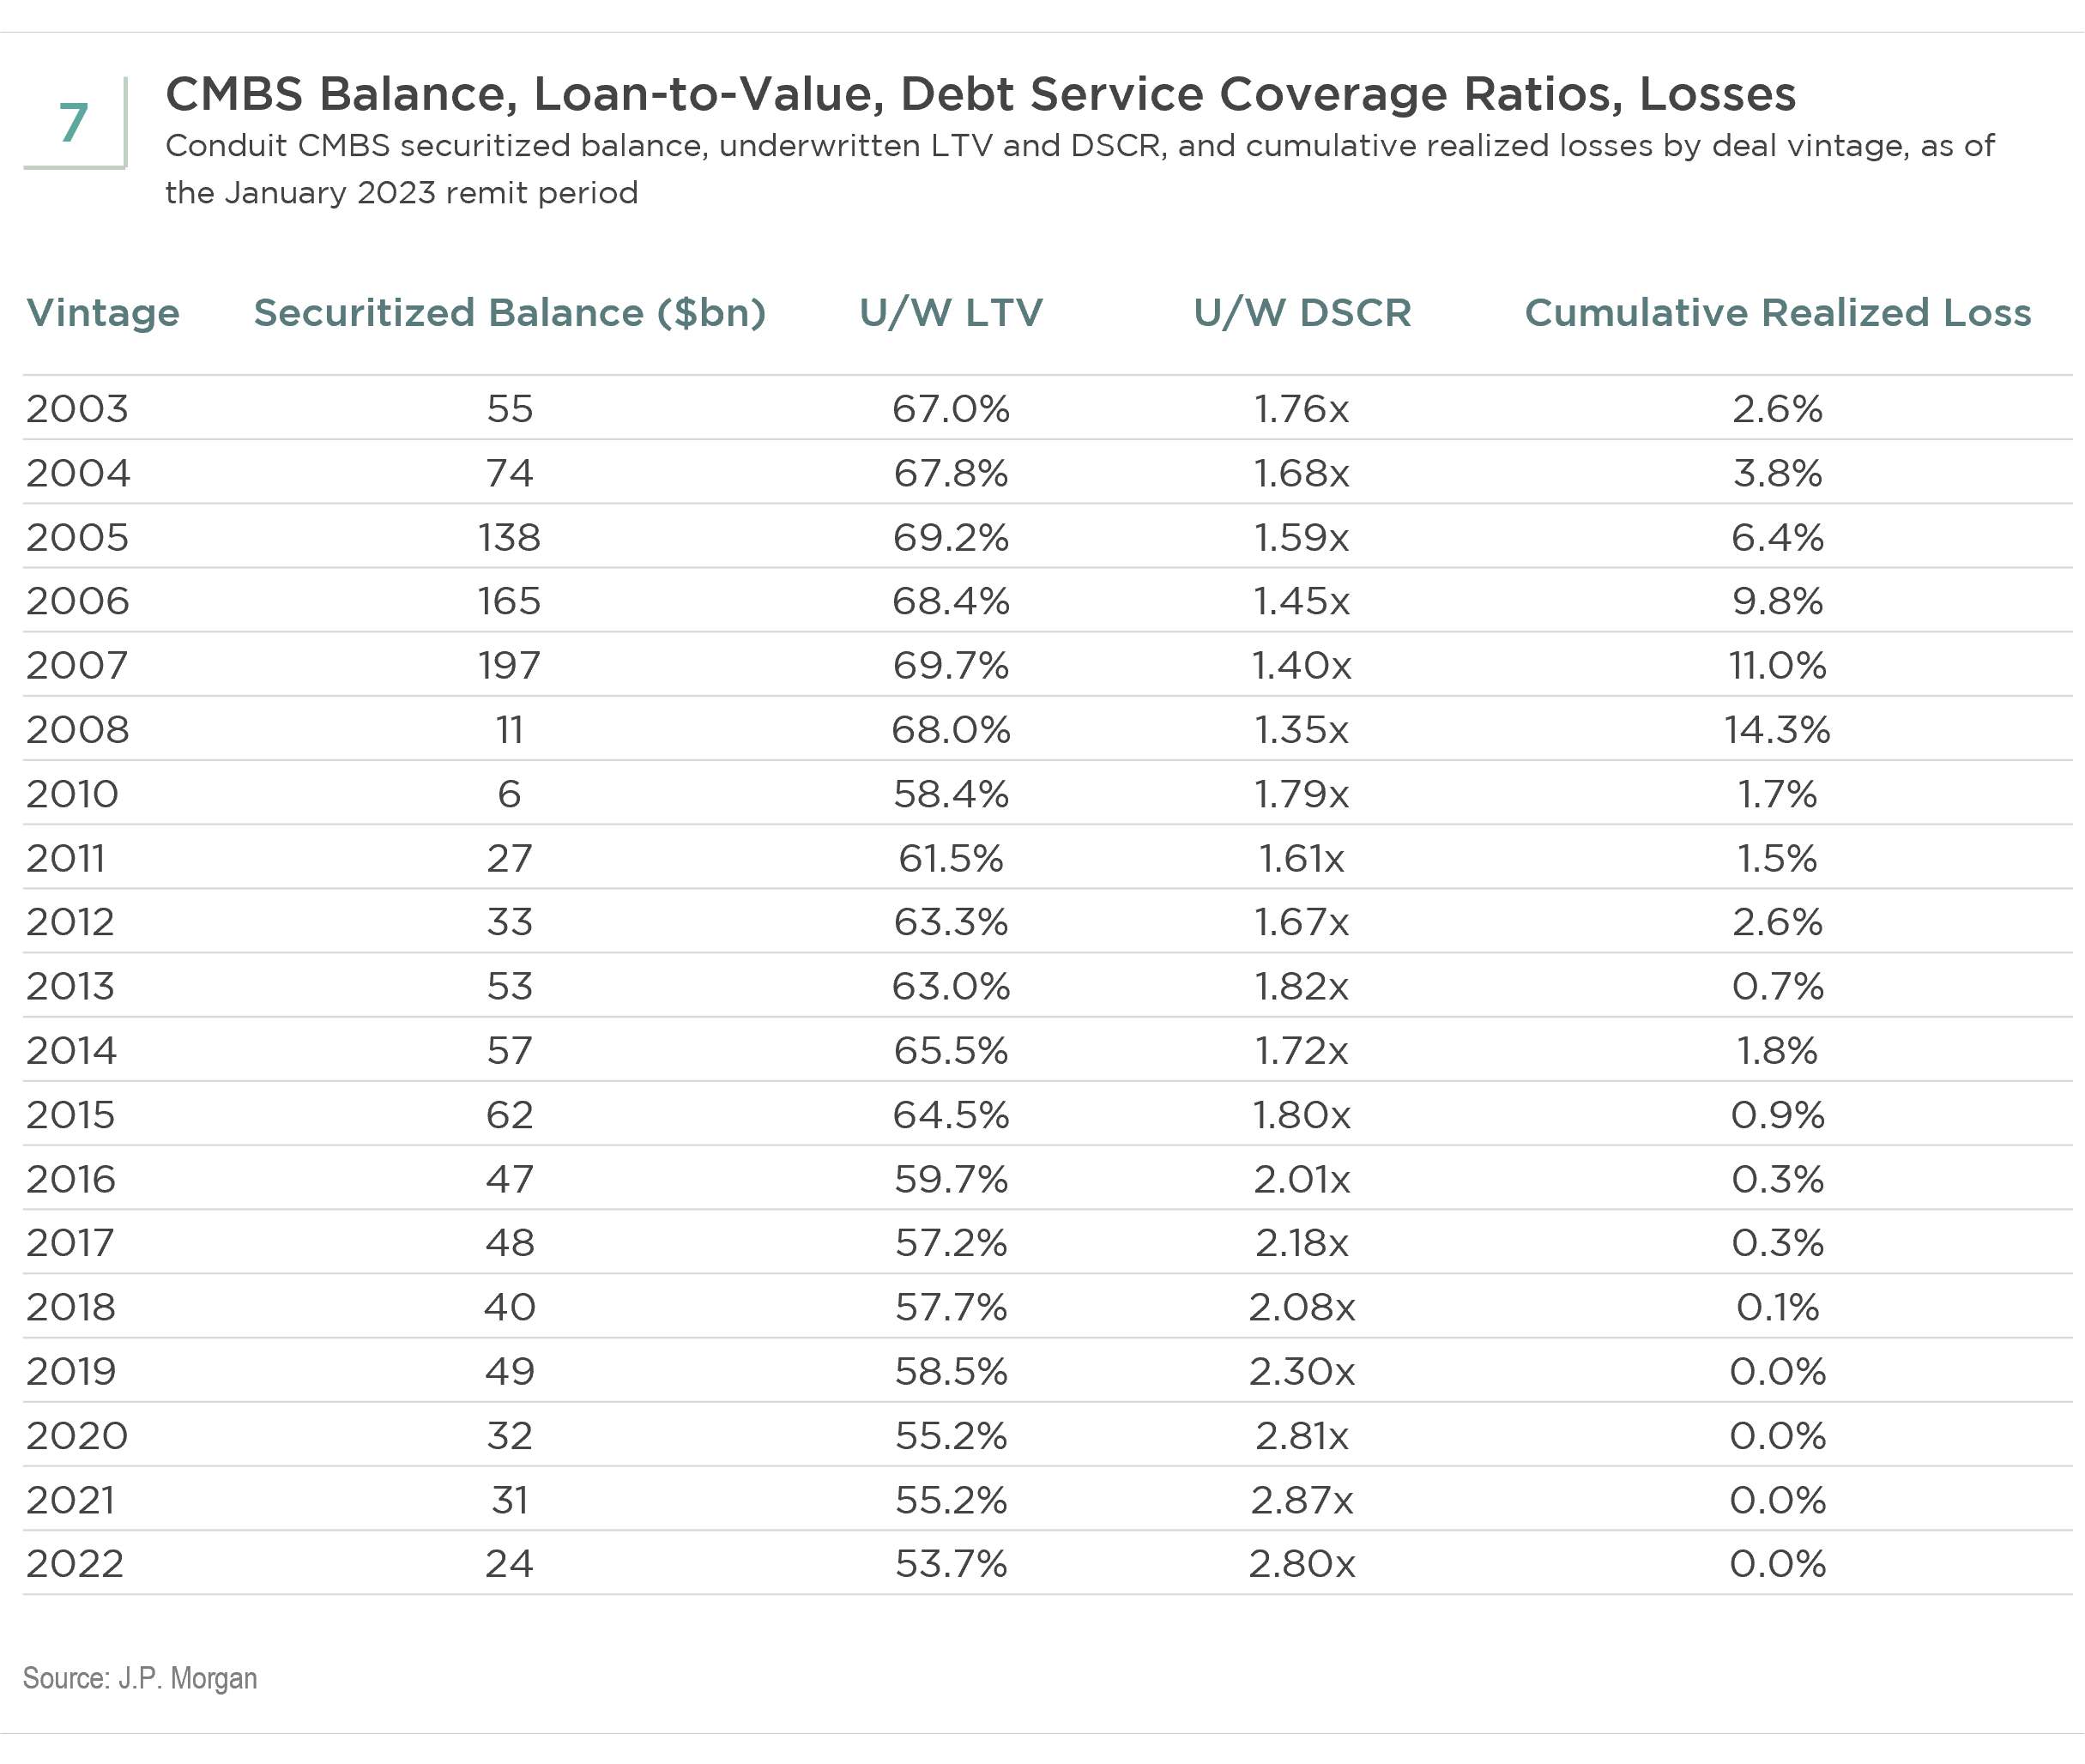
JP Morgan’s data on cumulative realized losses for CMBS of each historical vintage since 2003 suggests improved underwriting standards are a determining factor in minimizing losses (see Exhibit 7). Significantly lower LTV and higher DSCR since the GFC correlate to the very low losses in recent vintages. Taking these factors into consideration when calibrating losses, we believe CMBS should perform better than it had during the GFC, even with the current office sector crisis.
To estimate losses in the office sector, we need to assume the office vacancy rate will continue to increase over time by another 10 to 20 percent in our base case scenario if the work-from-home and hybrid work trends persist. However, the better underwriting, embedded price appreciation of seasoned loans, lack of distressed sellers, and other factors should offset some of the potential losses, which we believe can fall in the range of mid-to-high single-digits over the three-to-five-year timeframe. These mitigating factors were lacking during the GFC, leading to 9% to 14%. We believe most investment grade bonds should be able to withstand our loss scenario estimates, whereas non-investment grade bonds are likely to incur significant losses.
However, using the GFC as a guide, we expect that loan modifications with extensions will be more likely than sudden liquidation and loss crystallization. During the GFC, servicers granted many loan extensions to borrowers facing difficulty refinancing. The length of extensions ranged from under six months to five years or longer.
Conclusion and Investment Implications
There is no question that the secular shift to working from home and hybrid work arrangements poses tremendous challenges to the office sector within the CRE market. However, the prevalence of improved underwriting standards and other mitigating factors, including a decade of embedded price appreciation, along with the likelihood of loan extensions and modifications lead us to expect a prolonged reckoning for the sector, which could span across several years. We see a sudden collapse with massive liquidation losses that trigger systemic financial risk as an unlikely scenario.
In our best case scenario, we estimate that CMBS office losses ultimately settle in the mid-to-high single digits. In this scenario, most investment grade investors are protected from write-downs given sufficient credit enhancements. The most exposed investor class will be non-investment grade investors. These are mostly private debt funds with relatively smaller footprints in CRE lending and with longer investment horizons. Hence, their exposure is unlikely to cause any systemic issues for the real economy.
Credit curve steepening has turned drastic since 2022. Price discovery and transaction volume in CRE remain very low, particularly in the office sector, making value assessment very challenging and the ability to formulate high conviction difficult. However, we speculate that we may be near peak CMBS credit curve steepening, which would herald the entry of distressed investors as a welcome source of demand. Current yield levels are becoming increasingly compelling.
Groupthink is bad, especially at investment management firms. Brandywine Global therefore takes special care to ensure our corporate culture and investment processes support the articulation of diverse viewpoints. This blog is no different. The opinions expressed by our bloggers may sometimes challenge active positioning within one or more of our strategies. Each blogger represents one market view amongst many expressed at Brandywine Global. Although individual opinions will differ, our investment process and macro outlook will remain driven by a team approach.