

 Download PDF
What do meme stocks, cryptocurrencies, unprofitable technology stocks, and foreign ADRs with no claims on assets have in common? Collectively, they have become the poster children of speculation and risk for many popular financial news outlets. However, we have been shocked and dismayed to hear high yield corporate bonds mentioned in the same breath as meme stocks. We believe this indiscriminate categorization of high yield is nonsense and reflects a fundamental misunderstanding of the asset class today. High yield bonds are not get-rich-quick, opaque instruments promising tectonic shifts in how the world looks tomorrow. They are contractual cash flows with stated coupons and maturities, and the asset class as a whole has been tested over many cycles. We have long made the case for high yield as a compelling diversifier to the standard 60/40 U.S. equity, core investment grade bond portfolio. We have encouraged allocators to consider moving a portion of their equities and core fixed income to high yield. Even though high yield has endured a meaningful drawdown over the last six months, it generally would have helped the standard 60/40 portfolio. More importantly, we believe the case for high yield is even more compelling today. While we focus on the U.S. high yield market below, we see comparable opportunities in non-U.S. high yield markets.
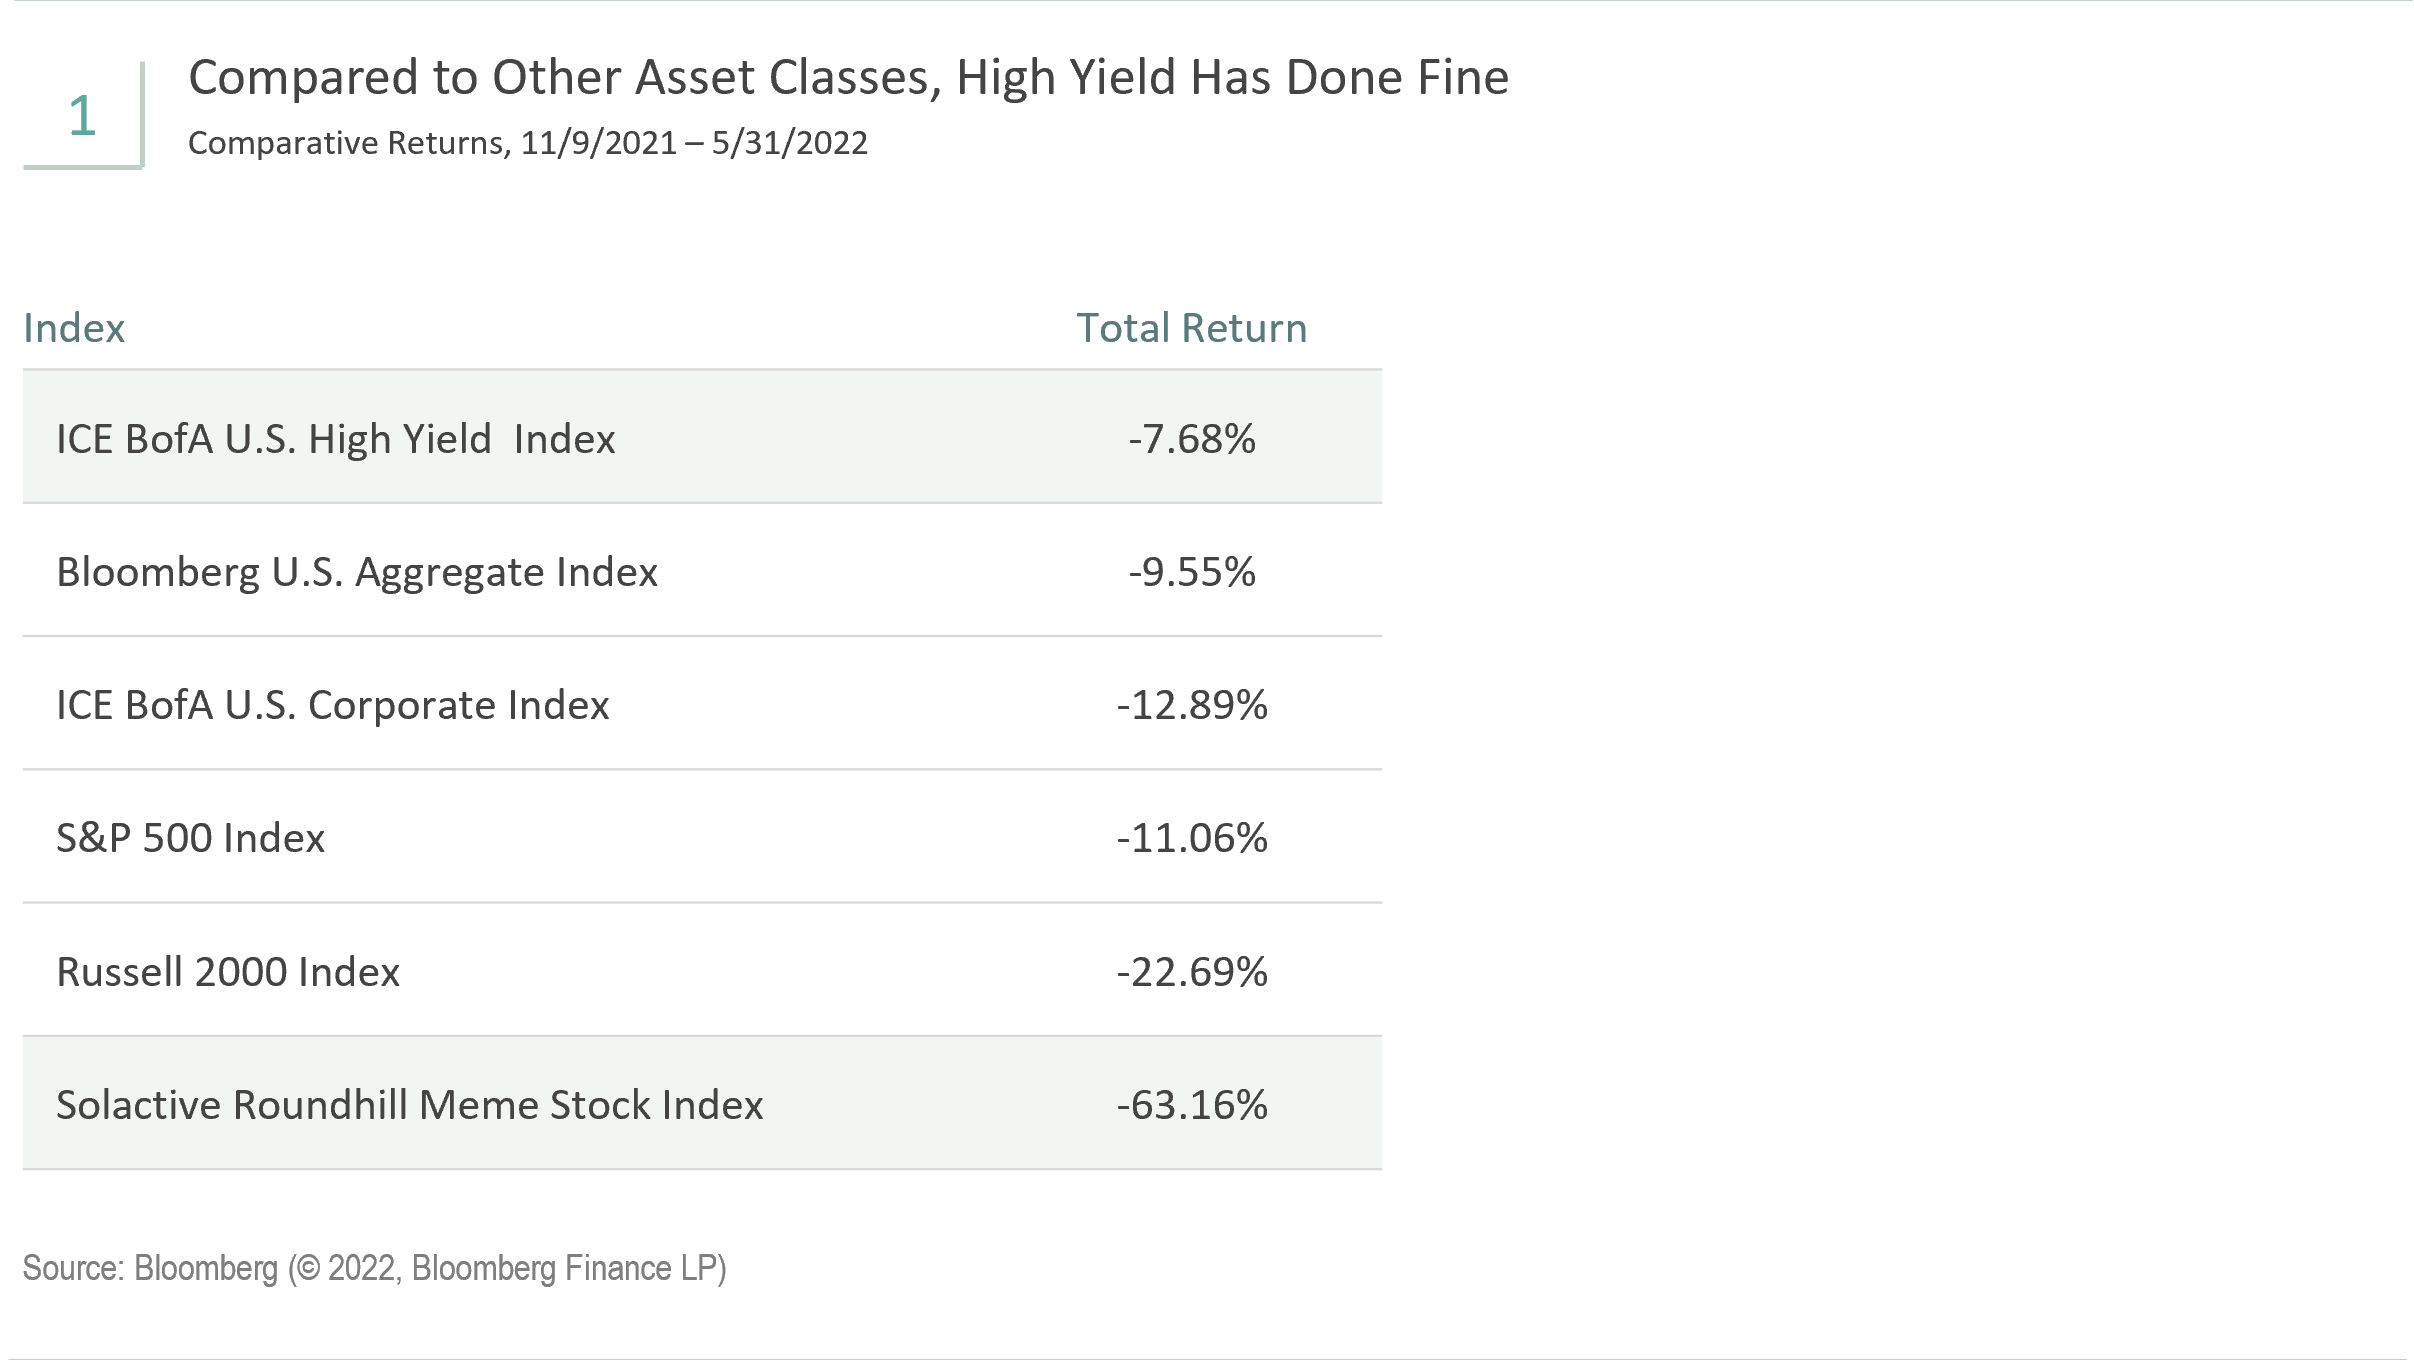
Performance Tells a Different Story…
Let us look at performance since November 9, 2021 (see Figure 1). We pick that date for two reasons. First, that is when some of the most extended financial assets began a precipitous downward valuation adjustment. Second, that is the first day we have performance for the Solactive Roundhill Meme Stock Index (the “MEME Index”). Over this time, the High Yield Index outperformed the MEME Index by over 55 percentage points, underscoring the inappropriateness of equating the two. The High Yield Index also outperformed the U.S. Aggregate Bond Index by 187 basis points and the Investment Grade Corporate Index by over 5 percentage points. On the equity side, high yield outpaced the S&P 500 by over 3 percentage points and the Russell 2000 by 15 percentage points.
…and So Does Risk
Those equating high yield to a meme stock might have the view that meme stocks are the riskiest stocks and high yield bonds are the riskiest bonds. However, the biggest risk impacting all financial assets has been interest rate risk. High yield bonds have less interest rate risk than most fixed income sectors and sit higher in the capital stack than equity. High yield bonds do have more default risk than the bonds in the U.S. Aggregate Bond Index and the Investment Grade Corporate Index but probably not as much as many fear.
700 High Yield Spread Could Be the New 900
While we believe in a strategic allocation to high yield, we know tactical investors who have historically legged into high yield when the option-adjusted spread was between 700 and 900 basis points. At 700 basis points, the market is priced for a high probability of a severe default cycle, and at 900 basis points, the market is priced for a default cycle worse than any we have seen in the history of the high yield market.
The 30-year history of the high yield market has coincided with a disinflationary environment. Now that we are in an inflationary environment, we believe adjustments are warranted. When high yield was priced for recession in 2016 and 2020, credit stress was concentrated in the energy, metals, and mining industries, which now make up about 15% of the High Yield Index. These industries typically perform the best in an inflationary environment. More broadly, inflation is good for credit quality. Inflation reduces the value of fixed-rate obligations. Principal and interest payments are made with nominal dollars, and inflation increases the nominal value of assets and cash flows.
As the high yield market has evolved, credit quality has improved. During the Global Financial Crisis (GFC) of 2007-2009, less than 40% of the high yield market was rated in the highest BB tier. Now, that percentage is well over 50%. Additionally, we believe that today’s BBs are better credits than the BBs of even five years ago. To reflect the improved credit quality within the high yield market, we believe a further adjustment is in order.
Furthermore, the vast majority of high yield bonds were issued over the last two years with low coupons and extended maturities. New issuance this year is down over 75% from last year because high yield issuers have almost no bonds that need to be refinanced this year or even in 2023 or 2024.
For these reasons, high yield defaults are currently well below long-term averages, which have also been moving lower over time. Our judgment is that these factors make a 700 basis points spread today more comparable to a 900 basis points spread during prior cycles. Tactical investors waiting for a 700 basis points spread to begin their moves into high yield may miss the opportunity. With defaults so low and fundamentals, such as interest coverage and leverage, still strong, investors have to question how wide can spreads actually get. The issuers are extremely reluctant to issue bonds at prevailing rates, which may indicate an opportunity for investors at these rates.
Post-GFC, 7.5% Yield-to-Worst Has Been a Good Starting Point for High Yield
The yield-to-worst of the High Yield Index began 2022 at 4.3%. It increased to 7.8% on May 19, and it is closer to 7% as we write this article. While there is plenty of near-term uncertainty, we believe inflation will level out in the next few years at a low enough rate that High Yield Index yields in this range will prove to be a good starting point—as they generally have since the GFC. Below we show forward returns of the High Yield Index each time it breached 7.5% yield-to-worst since the GFC (see Figure 2).
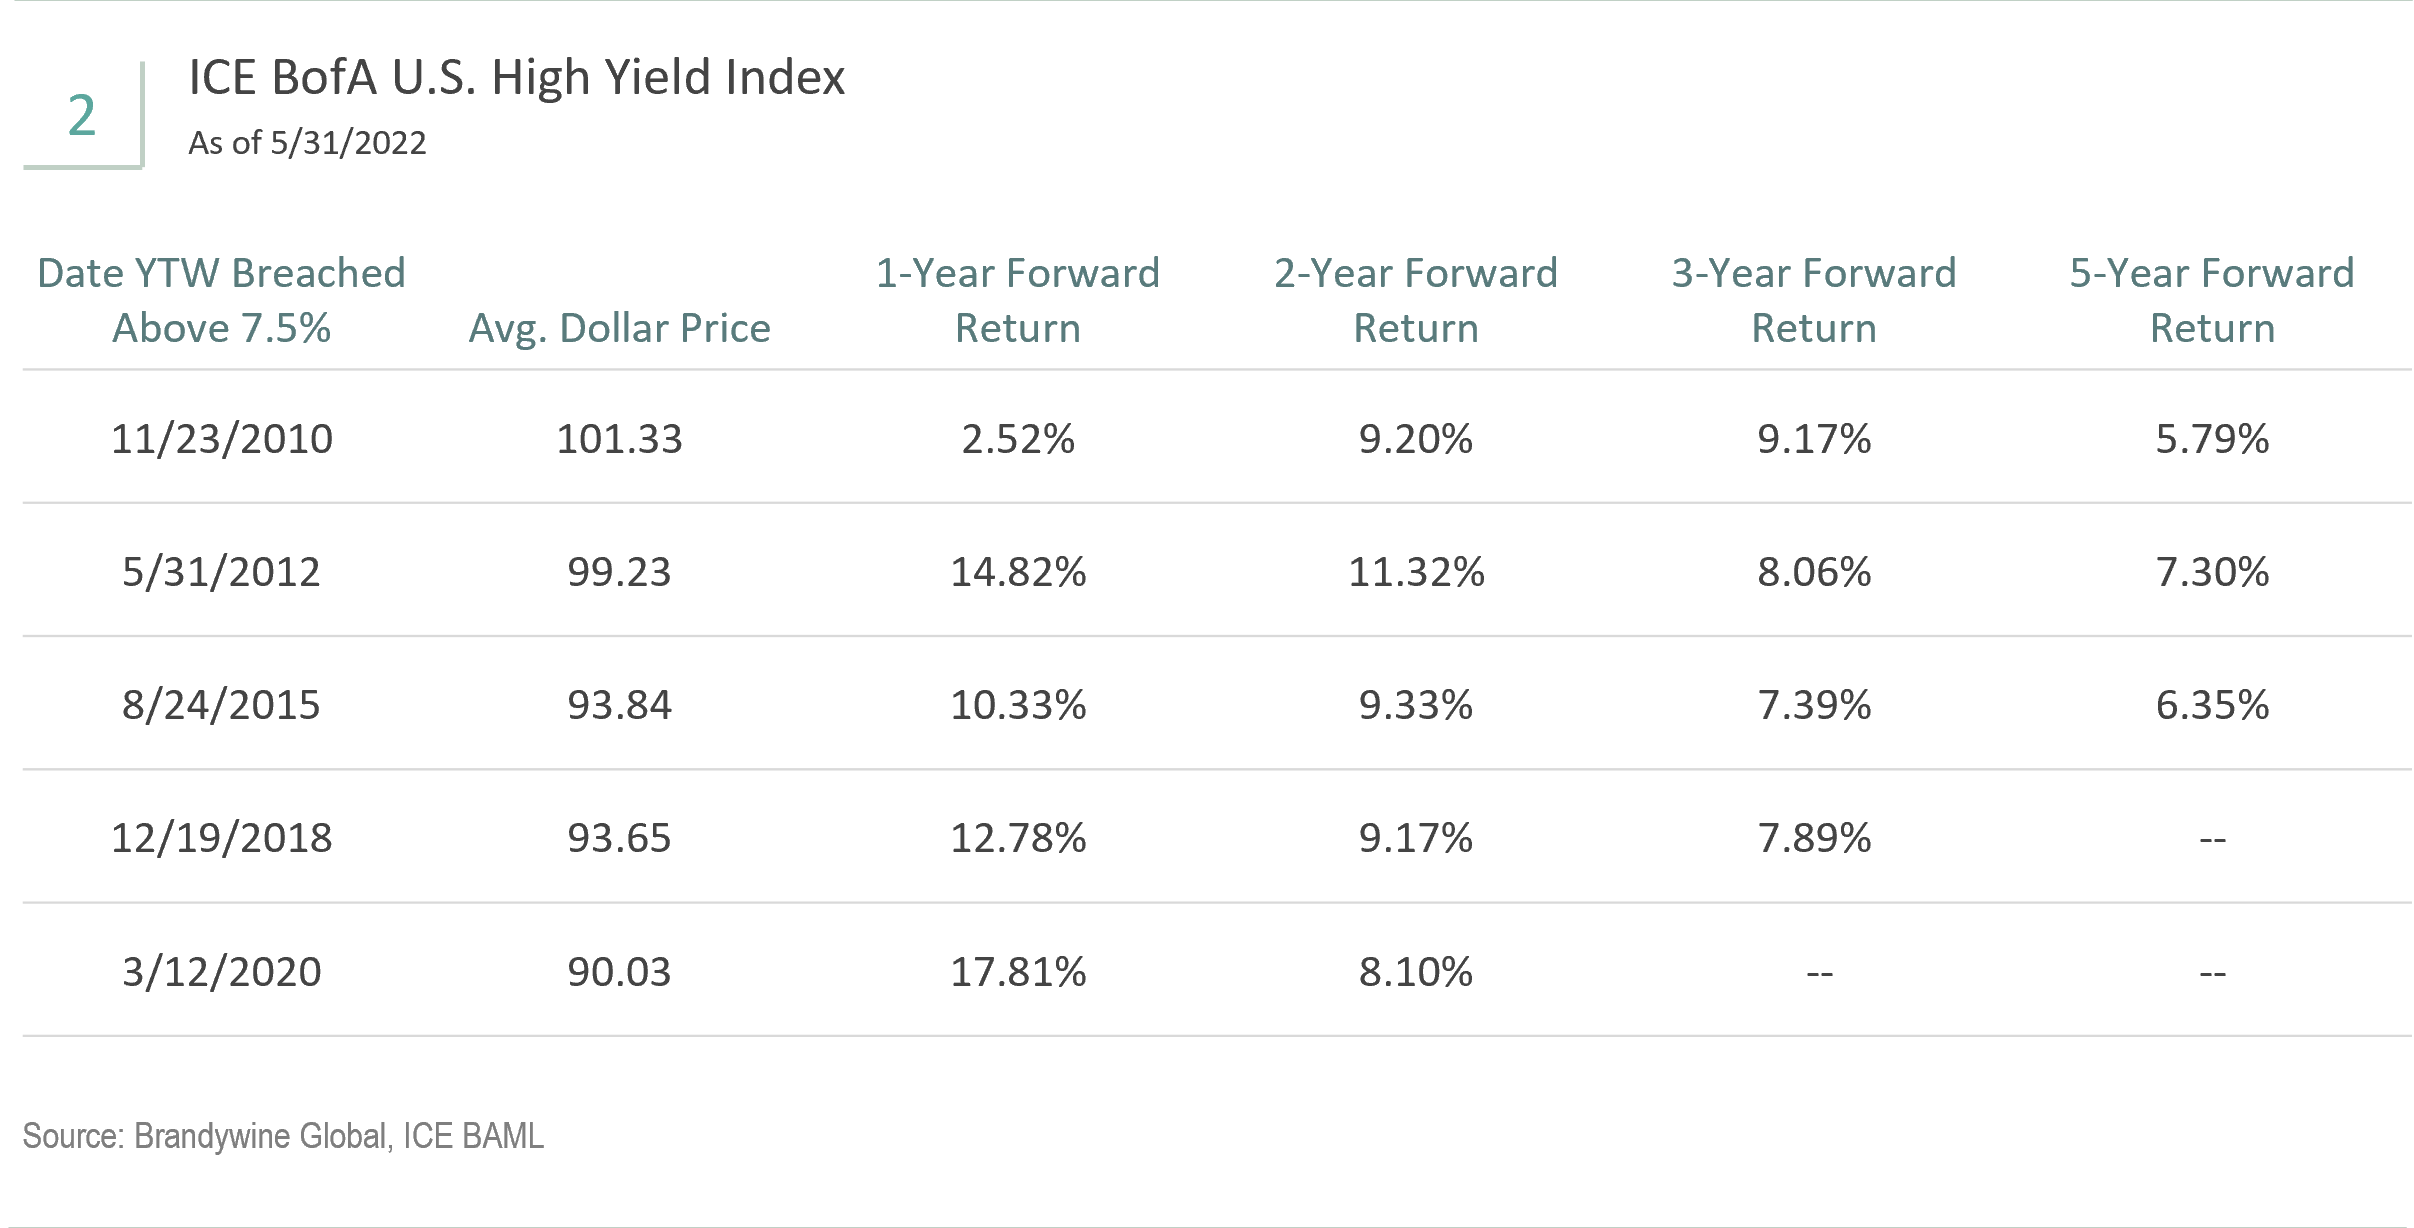
Yield-to-worst is typically the yield metric that we discuss with the high yield market. For most of the post-GFC period, the average dollar price of the High Yield Index has been above 100 cents on the dollar. Because most high yield bonds can be called before maturity, yield-to-worst is more likely when the price is above 100 cents.
Today, the average dollar price of the High Yield Index is 92.48 cents. When the dollar price is that low, the upside price appreciation potential is higher relative to the downside potential. The yield-to-outcome is more likely to be better than the yield-to-worst. We are most likely late cycle, which is when we typically see increased mergers and acquisitions (M&A) activity. If a high yield issuer is acquired, the bonds frequently appreciate above 100 cents, making the yield-to-outcome materially higher than the yield-to-worst if the bonds were well below par. “Jump risk” or event risk works both as a negative from defaulting and a positive from acquisition. Private equity is sitting on a war chest of capital ready to deploy as are private credit and SPACs, which have a short window to deploy capital. Strategic buyers, typically investment grade companies, are lying in the weeds. We are seeing strategic acquisitions ramping up with HP Inc. set to acquire Poly, formerly known as Plantronics, and Intercontinental Exchange to acquire Black Knight. Private equity is pouncing with Thoma Bravo acquiring SailPoint Technologies, and debt capital to be provided by private credit firms, including Golub Capital and Blackstone. Apollo is buying Tenneco Inc. Even Elon Musk may want Twitter.
Leg In to High Yield as We Approach 8%, 9%, 10%
Legging in to high yield as yields approach 8%, 9%, and 10% may be one strategy to overcome concerns about timing. The High Yield Index experienced its strongest rally of the year as the yield-to-worst approached 8% and the option-adjusted spread approached 500 basis points. If we reach a 9% yield-to-worst, it is possible the spread will be much higher than 600 basis points. That is because the 5-year Treasury yield has increased to 2.85% from 1.26% at the beginning of 2022. If the 5-year Treasury yield moves materially lower, and the High Yield Index yield-to-worst approaches 9%, the spread might increase at a faster pace than the yield-to-worst. As a result, we prefer buy points based on yield rather than spread at this time.
Groupthink is bad, especially at investment management firms. Brandywine Global therefore takes special care to ensure our corporate culture and investment processes support the articulation of diverse viewpoints. This blog is no different. The opinions expressed by our bloggers may sometimes challenge active positioning within one or more of our strategies. Each blogger represents one market view amongst many expressed at Brandywine Global. Although individual opinions will differ, our investment process and macro outlook will remain driven by a team approach.