

 Download PDF
The yield of the U.S. high yield market, as measured by the ICE BofA U.S. High Yield Index, has been in the 8-9% range for much of the last year, and was close to 9% as of May 31, 2023. That compares to a 20-year average of about 7.6% and a 10-year average of 6.3%. The spread is about 470 basis points compared to a 20-year average of 520 basis points and a 10-year average of 450 basis points. Some argue that the spread is really all that matters, and the high yield market is vulnerable because of the elevated risk of recession. We counter that you can pay your bills with the yield, not the spread. Both the spread and the yield matter. And currently, we believe the spread is reasonable, and the yield is very attractive.
High Yield Has Done Well Since the Yield Approached 9% In June 2022
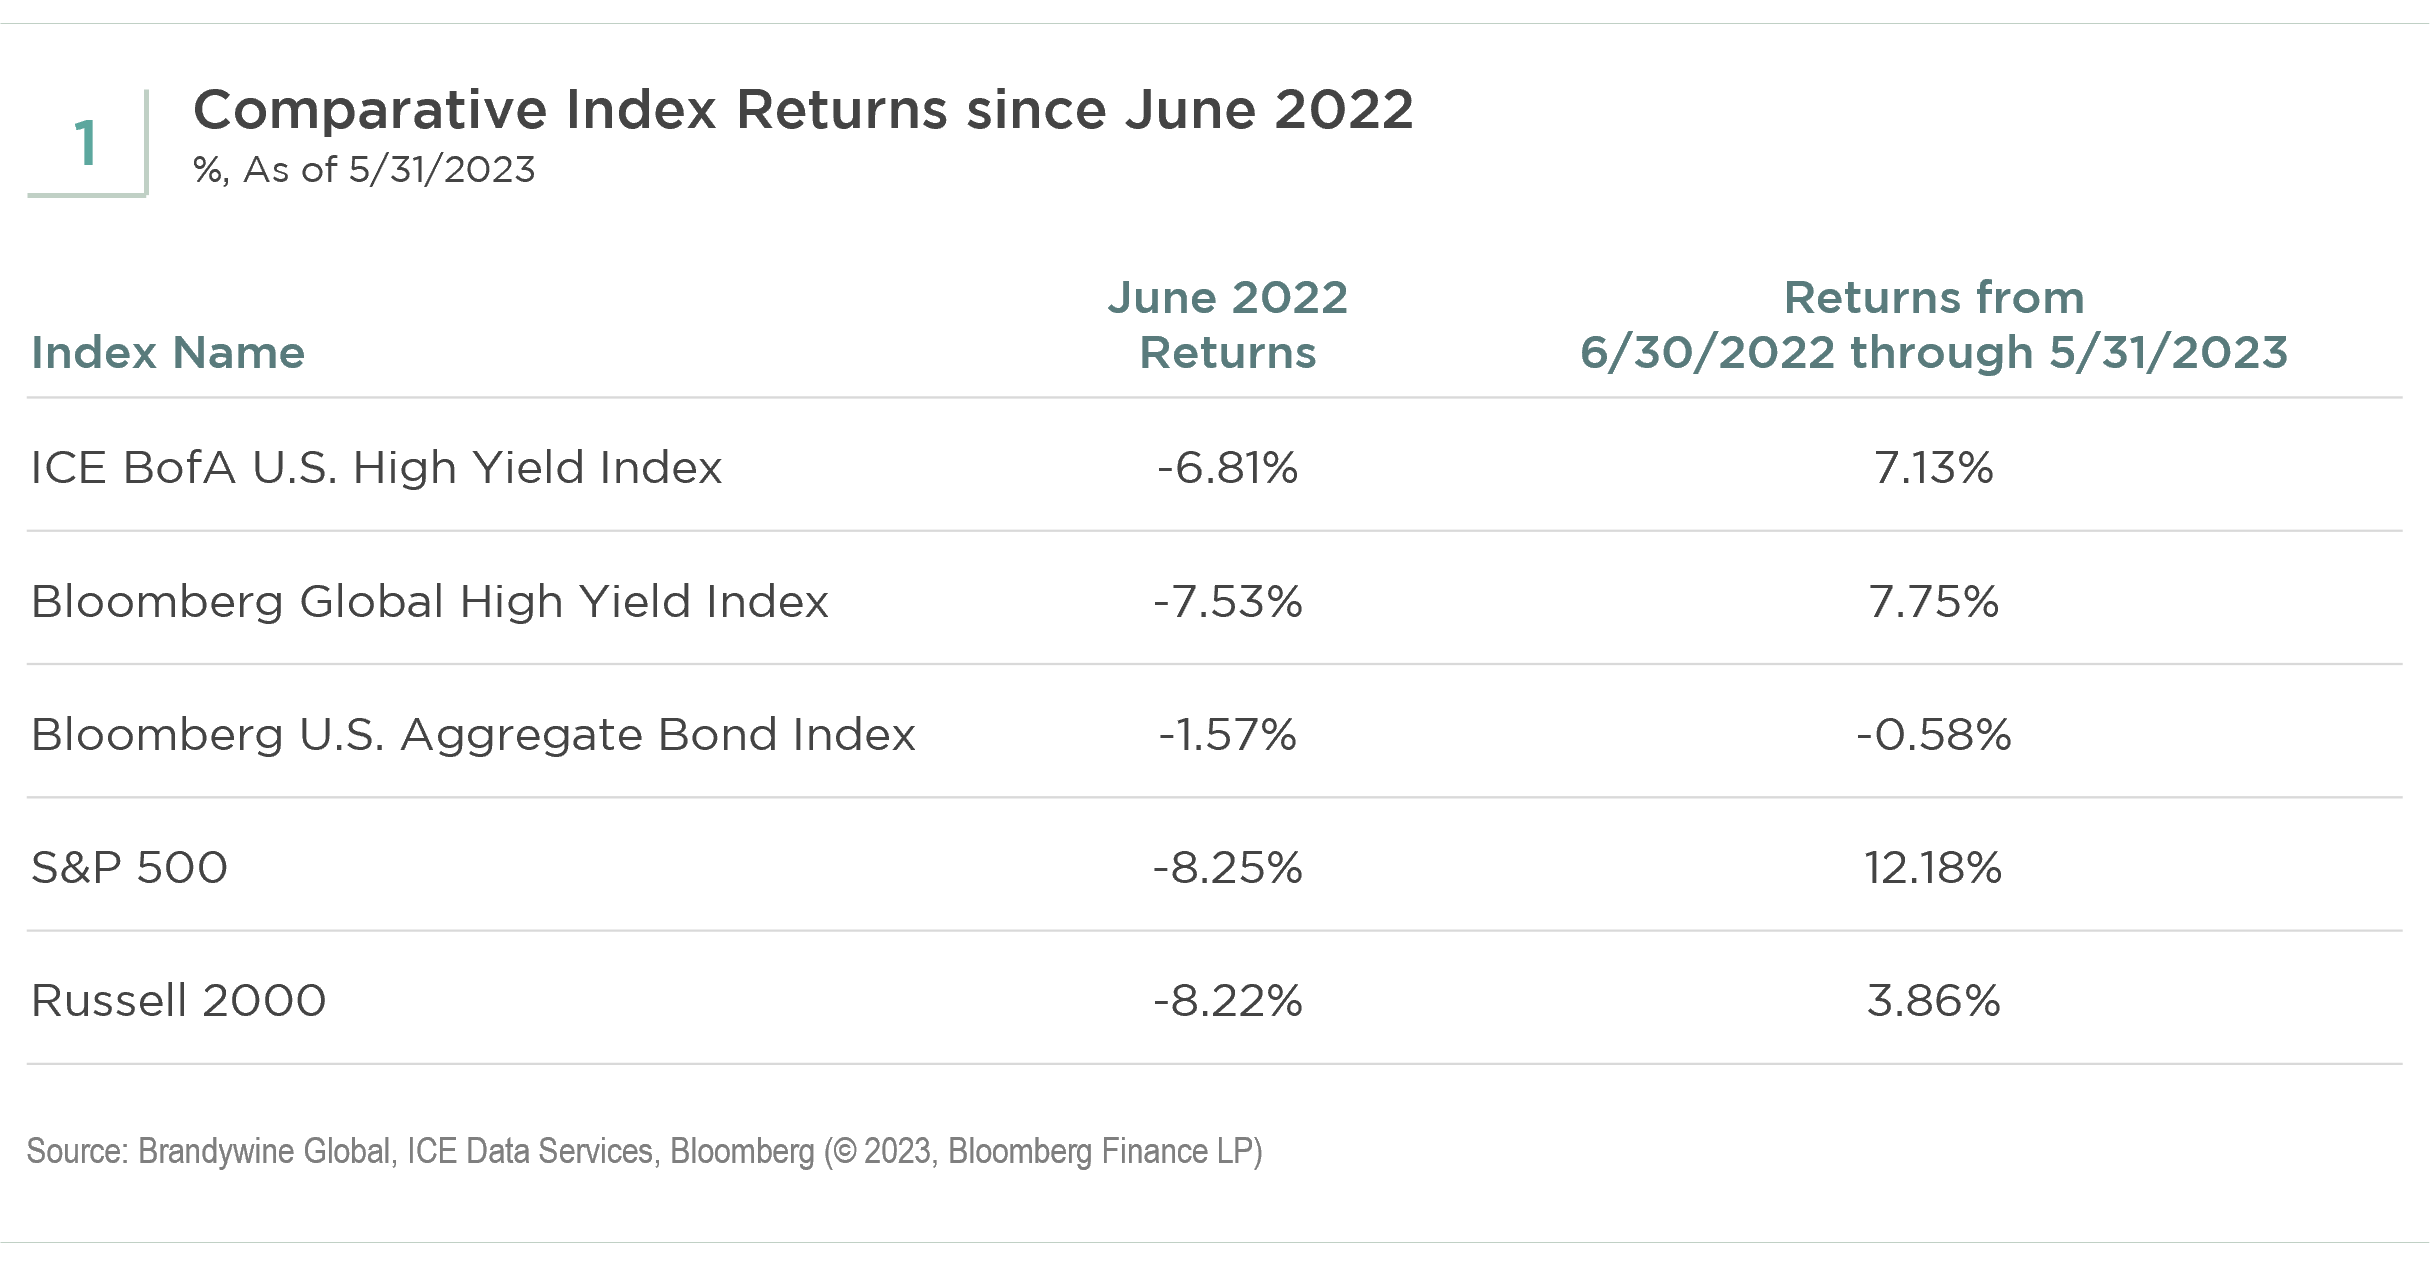
June 2022 was a brutal month for financial assets. Coming into that month, the market was discounting a peak federal (fed) funds rate of just under 3%. By the end of the month, the market was discounting a peak fed funds rate of 3.5%. Those expectations seem quaint now that the fed funds rate is over 5% and the market is discounting another 25 basis points hike over the next Federal Open Market Committee meeting or two. The second column in the table below shows the returns of various asset classes for June 2022 (see Figure 1). Core fixed income, as represented by the Bloomberg U.S. Aggregate Bond Index, held up materially better than the other asset classes in that month. Since then, however, the other asset classes have performed far better as shown in the third column.
Both the Spread and Yield Have Contributed
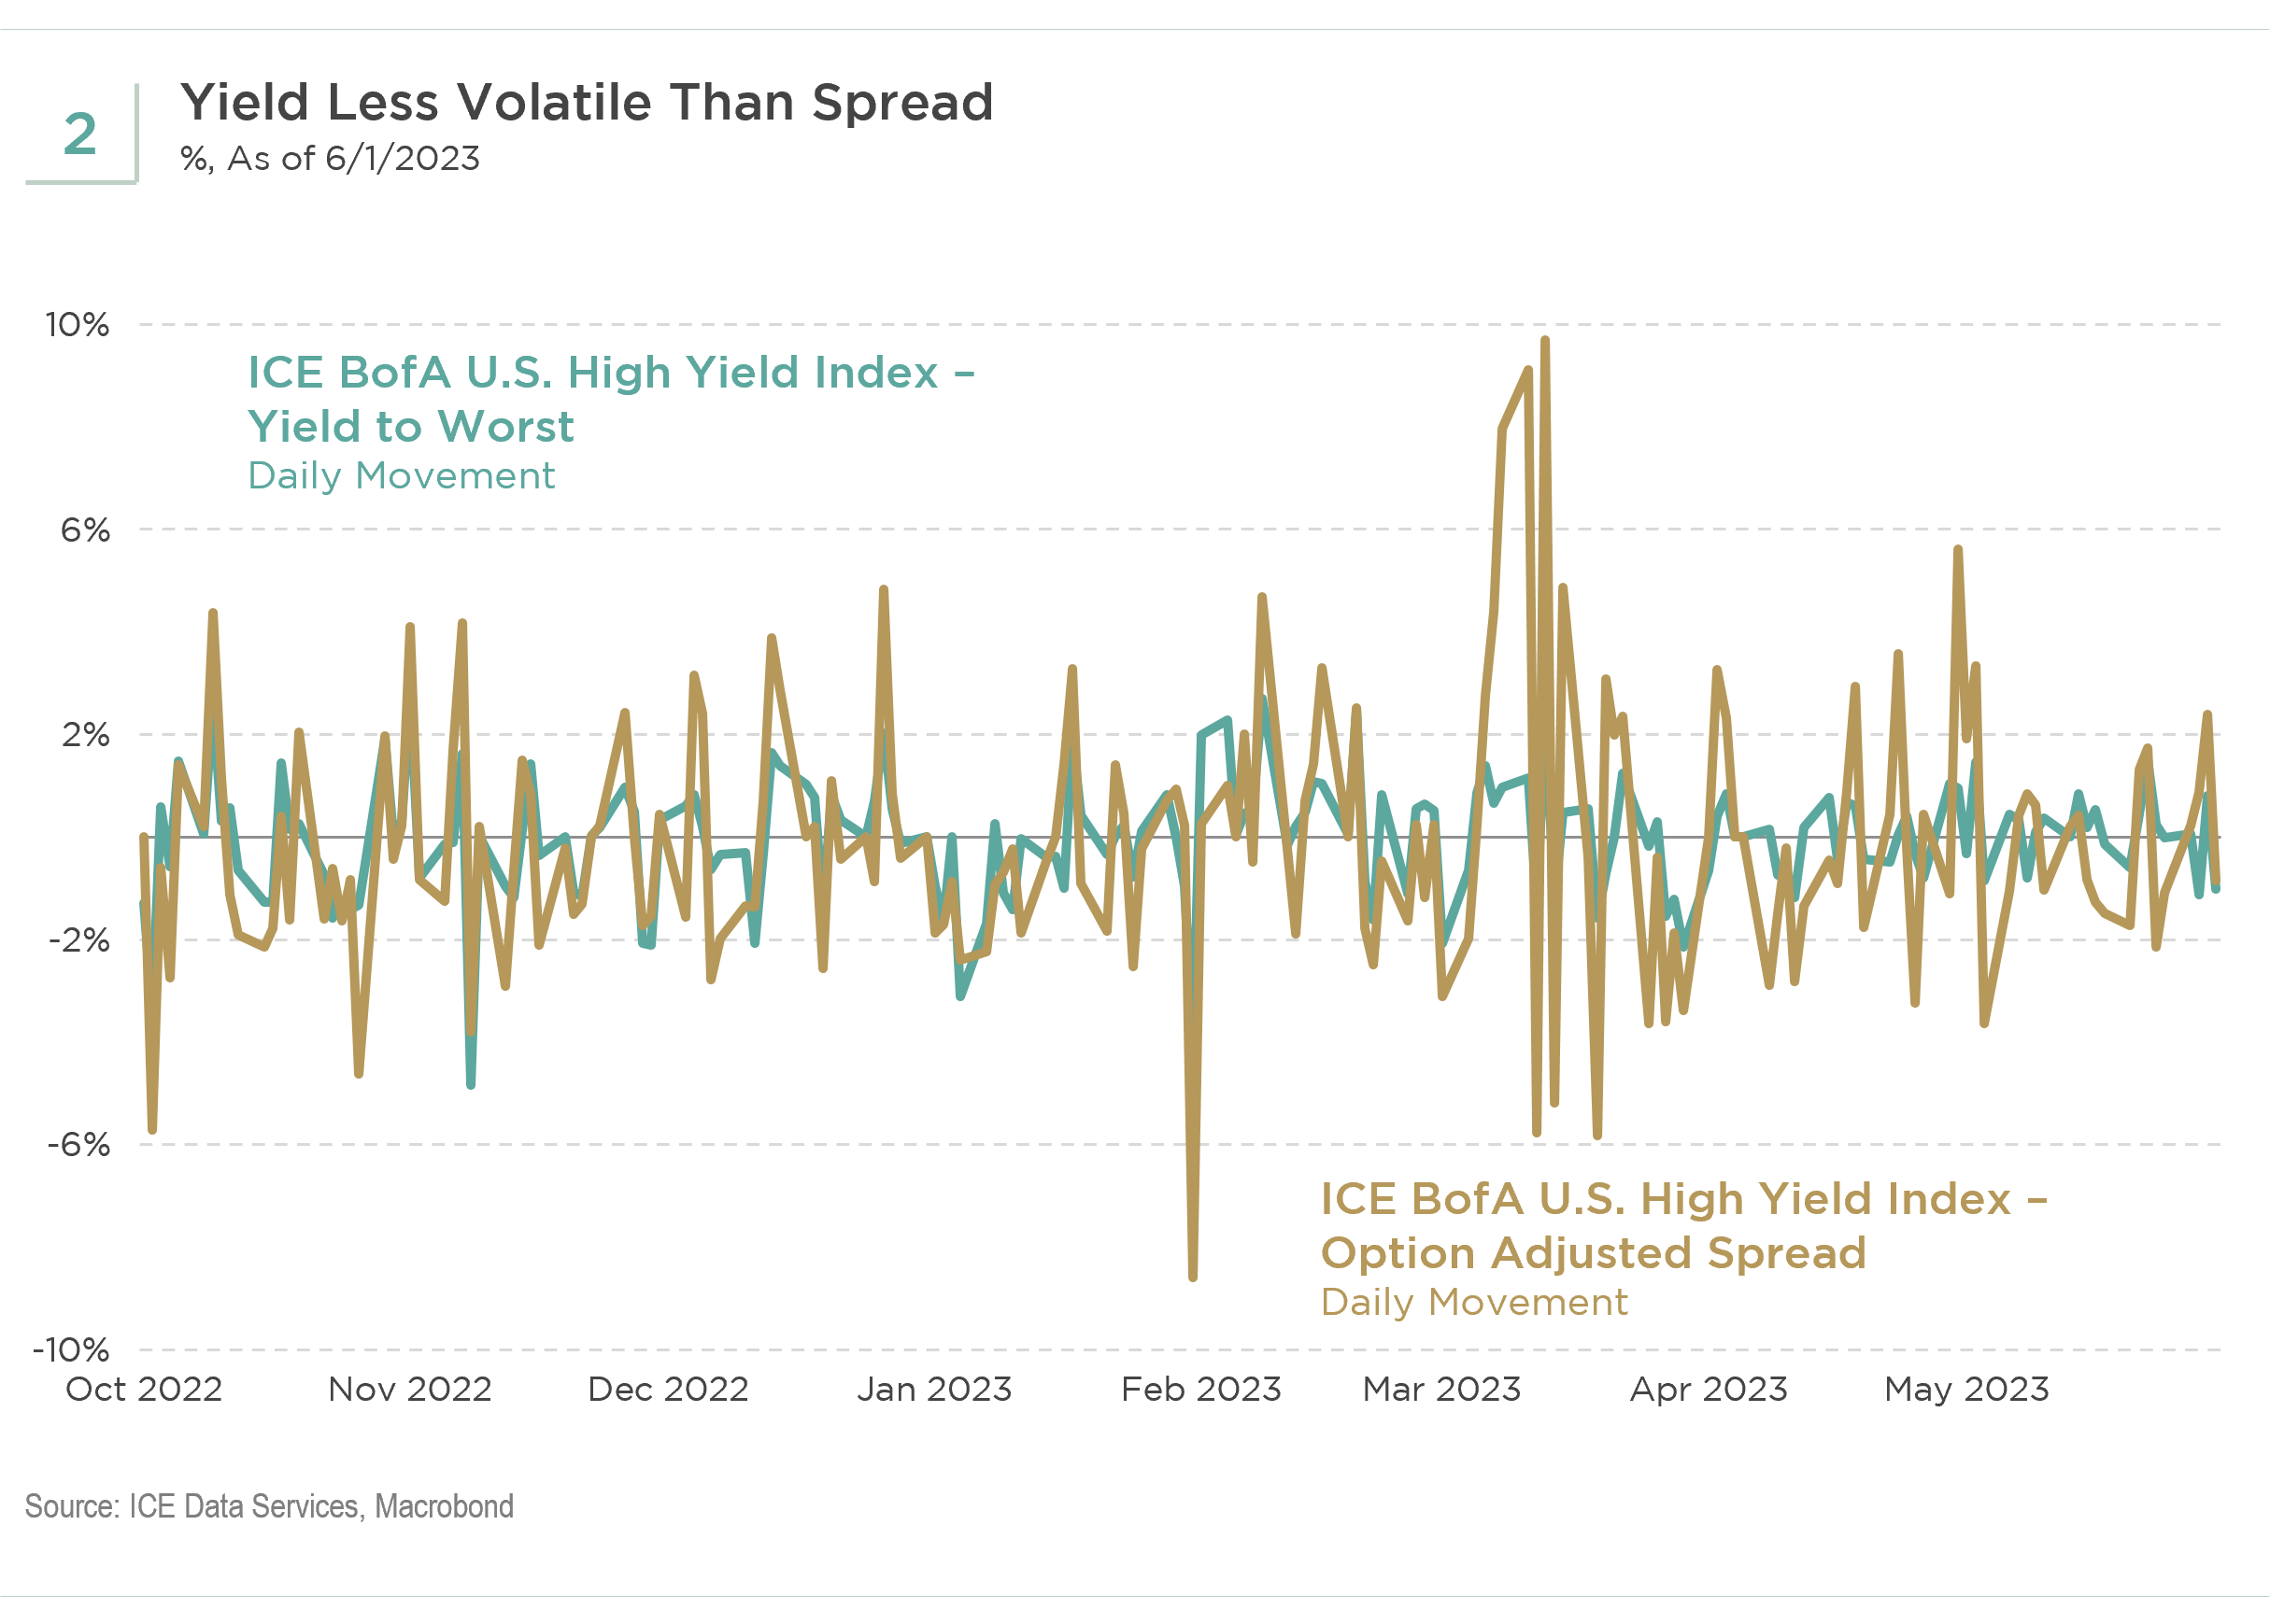
Why has high yield performed so much better than core fixed income and the Russell 2000 since June 30, 2022? Was it the spread or the yield? It was both. During June 2022, the spread of the high yield index increased from the low 400s to the high 500s, and the yield increased from a bit above 7% to close to 9%. Since then, the yield has been much more stable than the spread, especially since September 30, 2022, as we show in the chart below (see Figure 2). Start to finish, the spread has narrowed about 120 basis points, offsetting the 70-basis points increase in the 5-year Treasury yield. The spread certainly helped over the last 11 months, but the high starting yield also played an important role.
Going Forward, the Yield May Offset Spread Widening
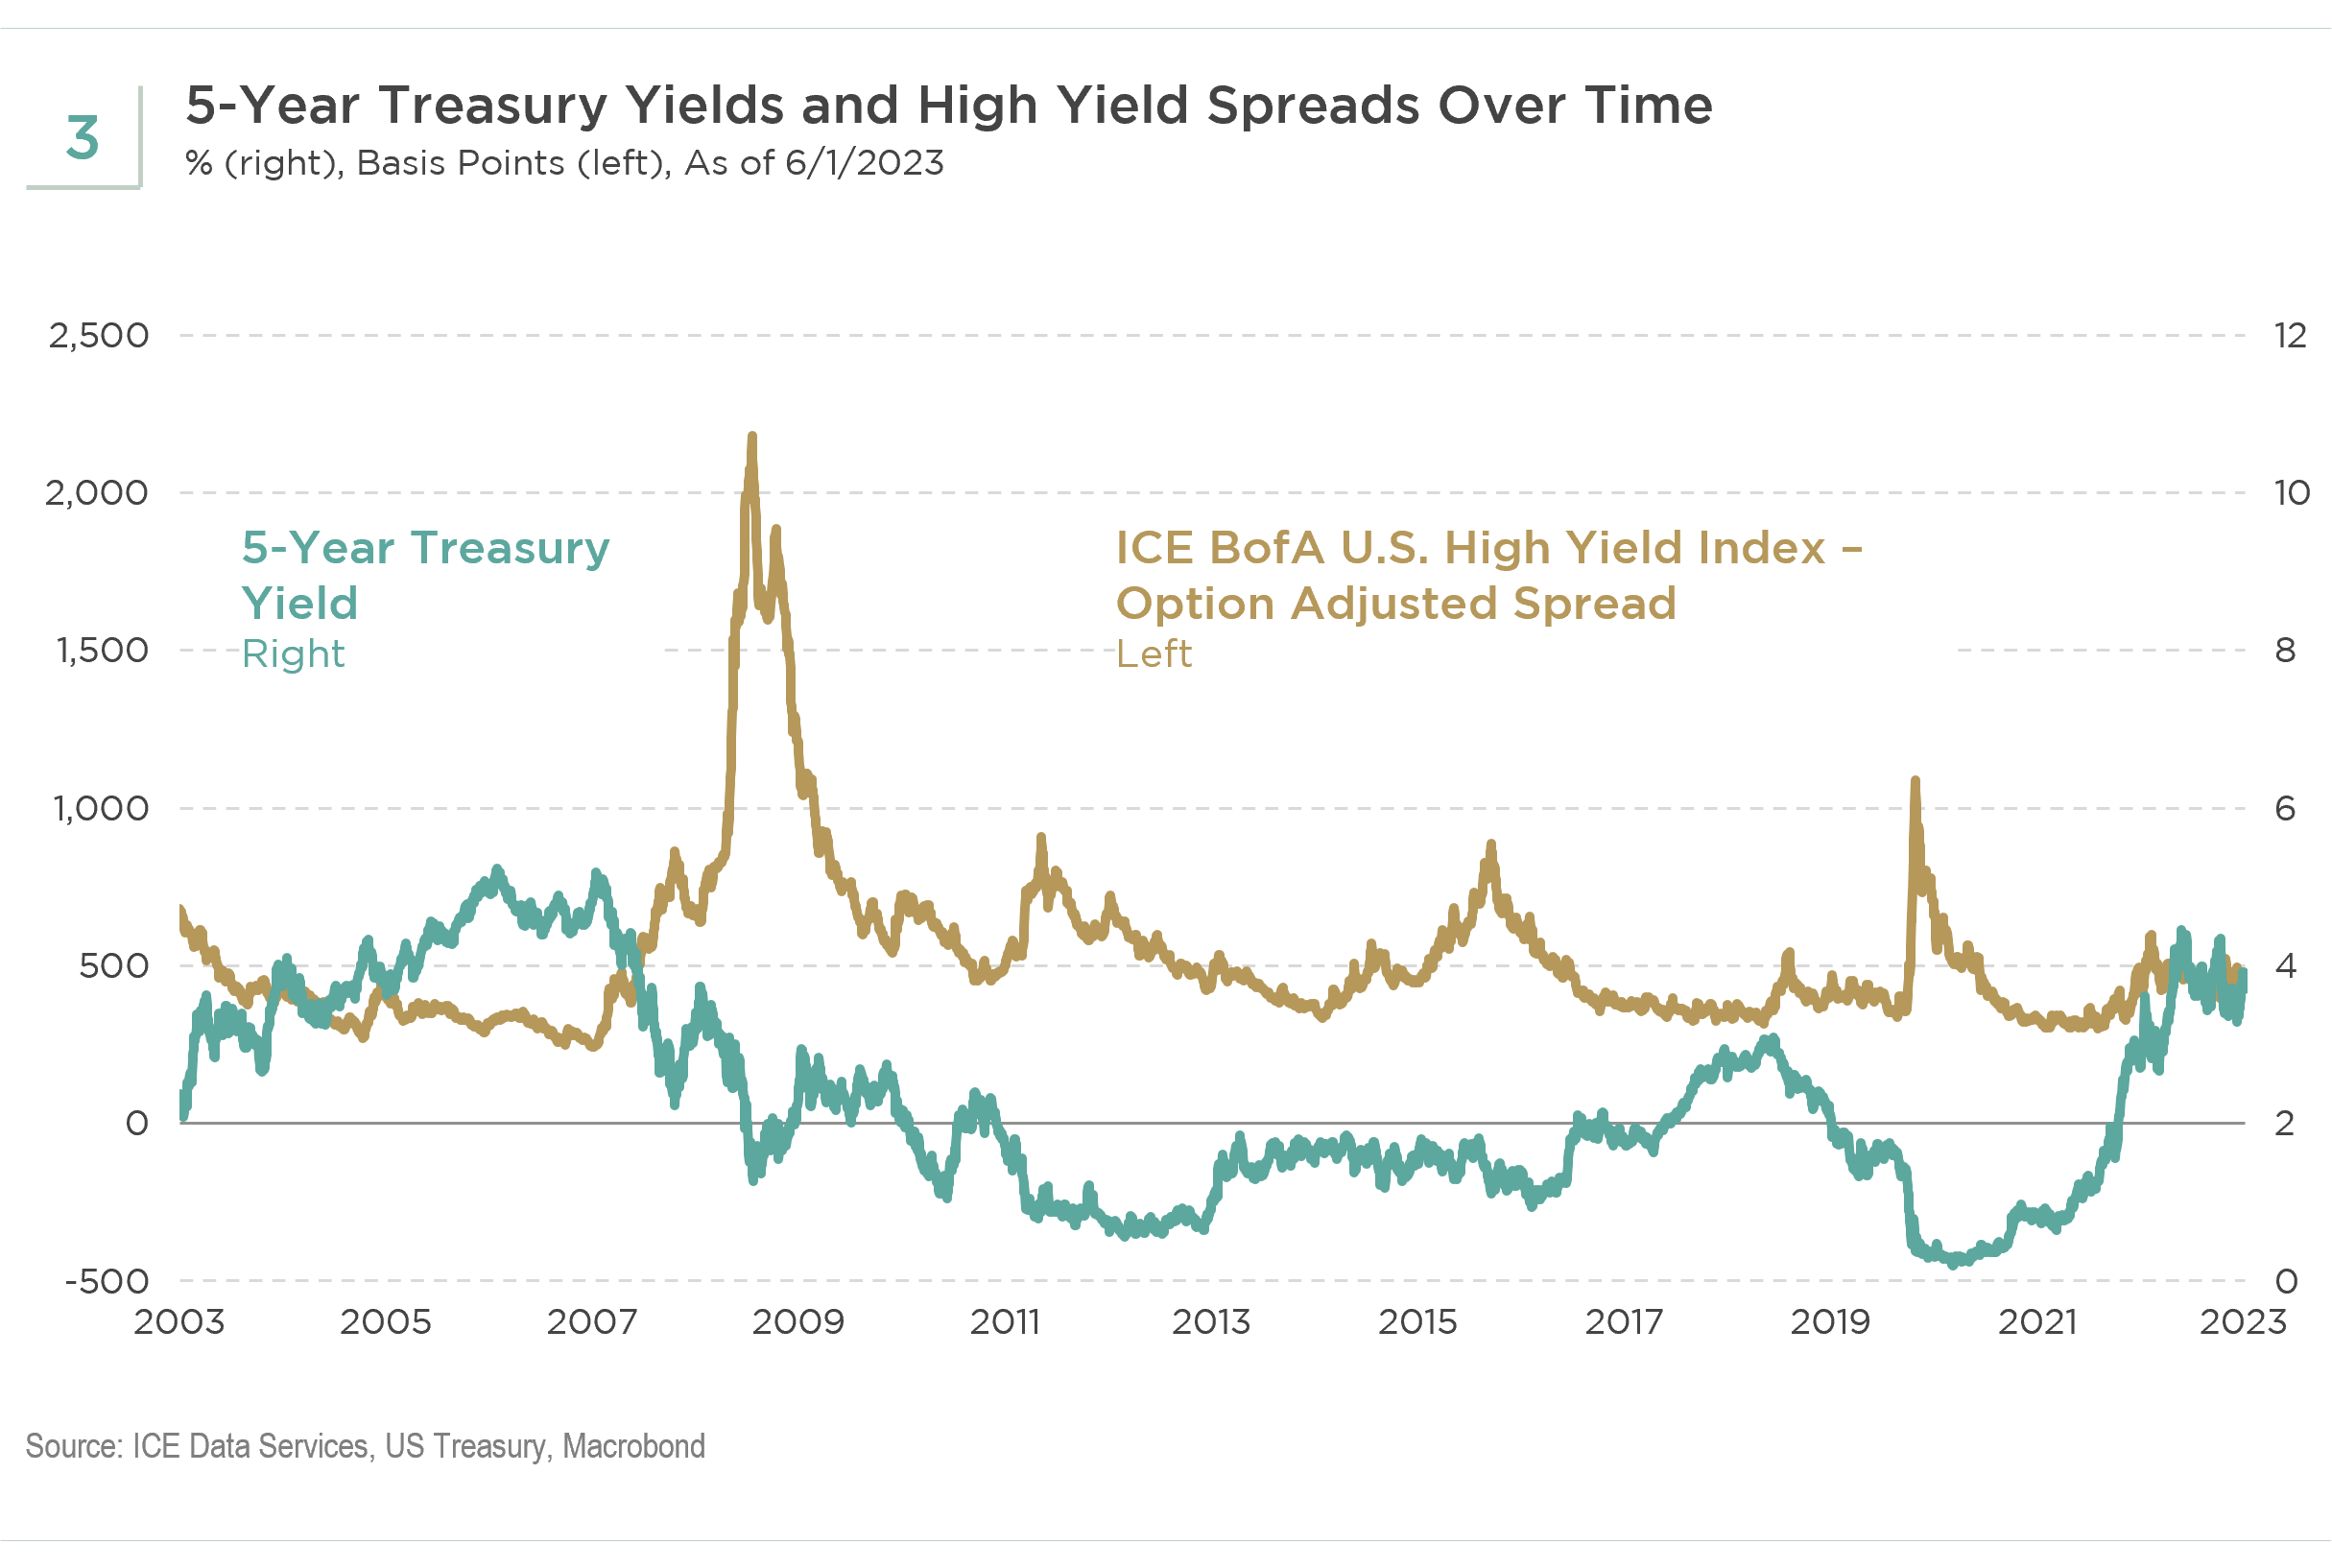
Let us assume that over the next year the high yield spread widens from 470 basis points to 600 basis points. What happens to the yield? If the 5-year Treasury yield declines from 3.8% to 2.5%, then the yield of the high yield index will still be near 9%. As we show in the chart below, widening spreads typically coincide with—and are, in part, caused by—declining Treasury yields (see Figure 3).
The Yield of the High Yield Index Is Rarely Above 10%
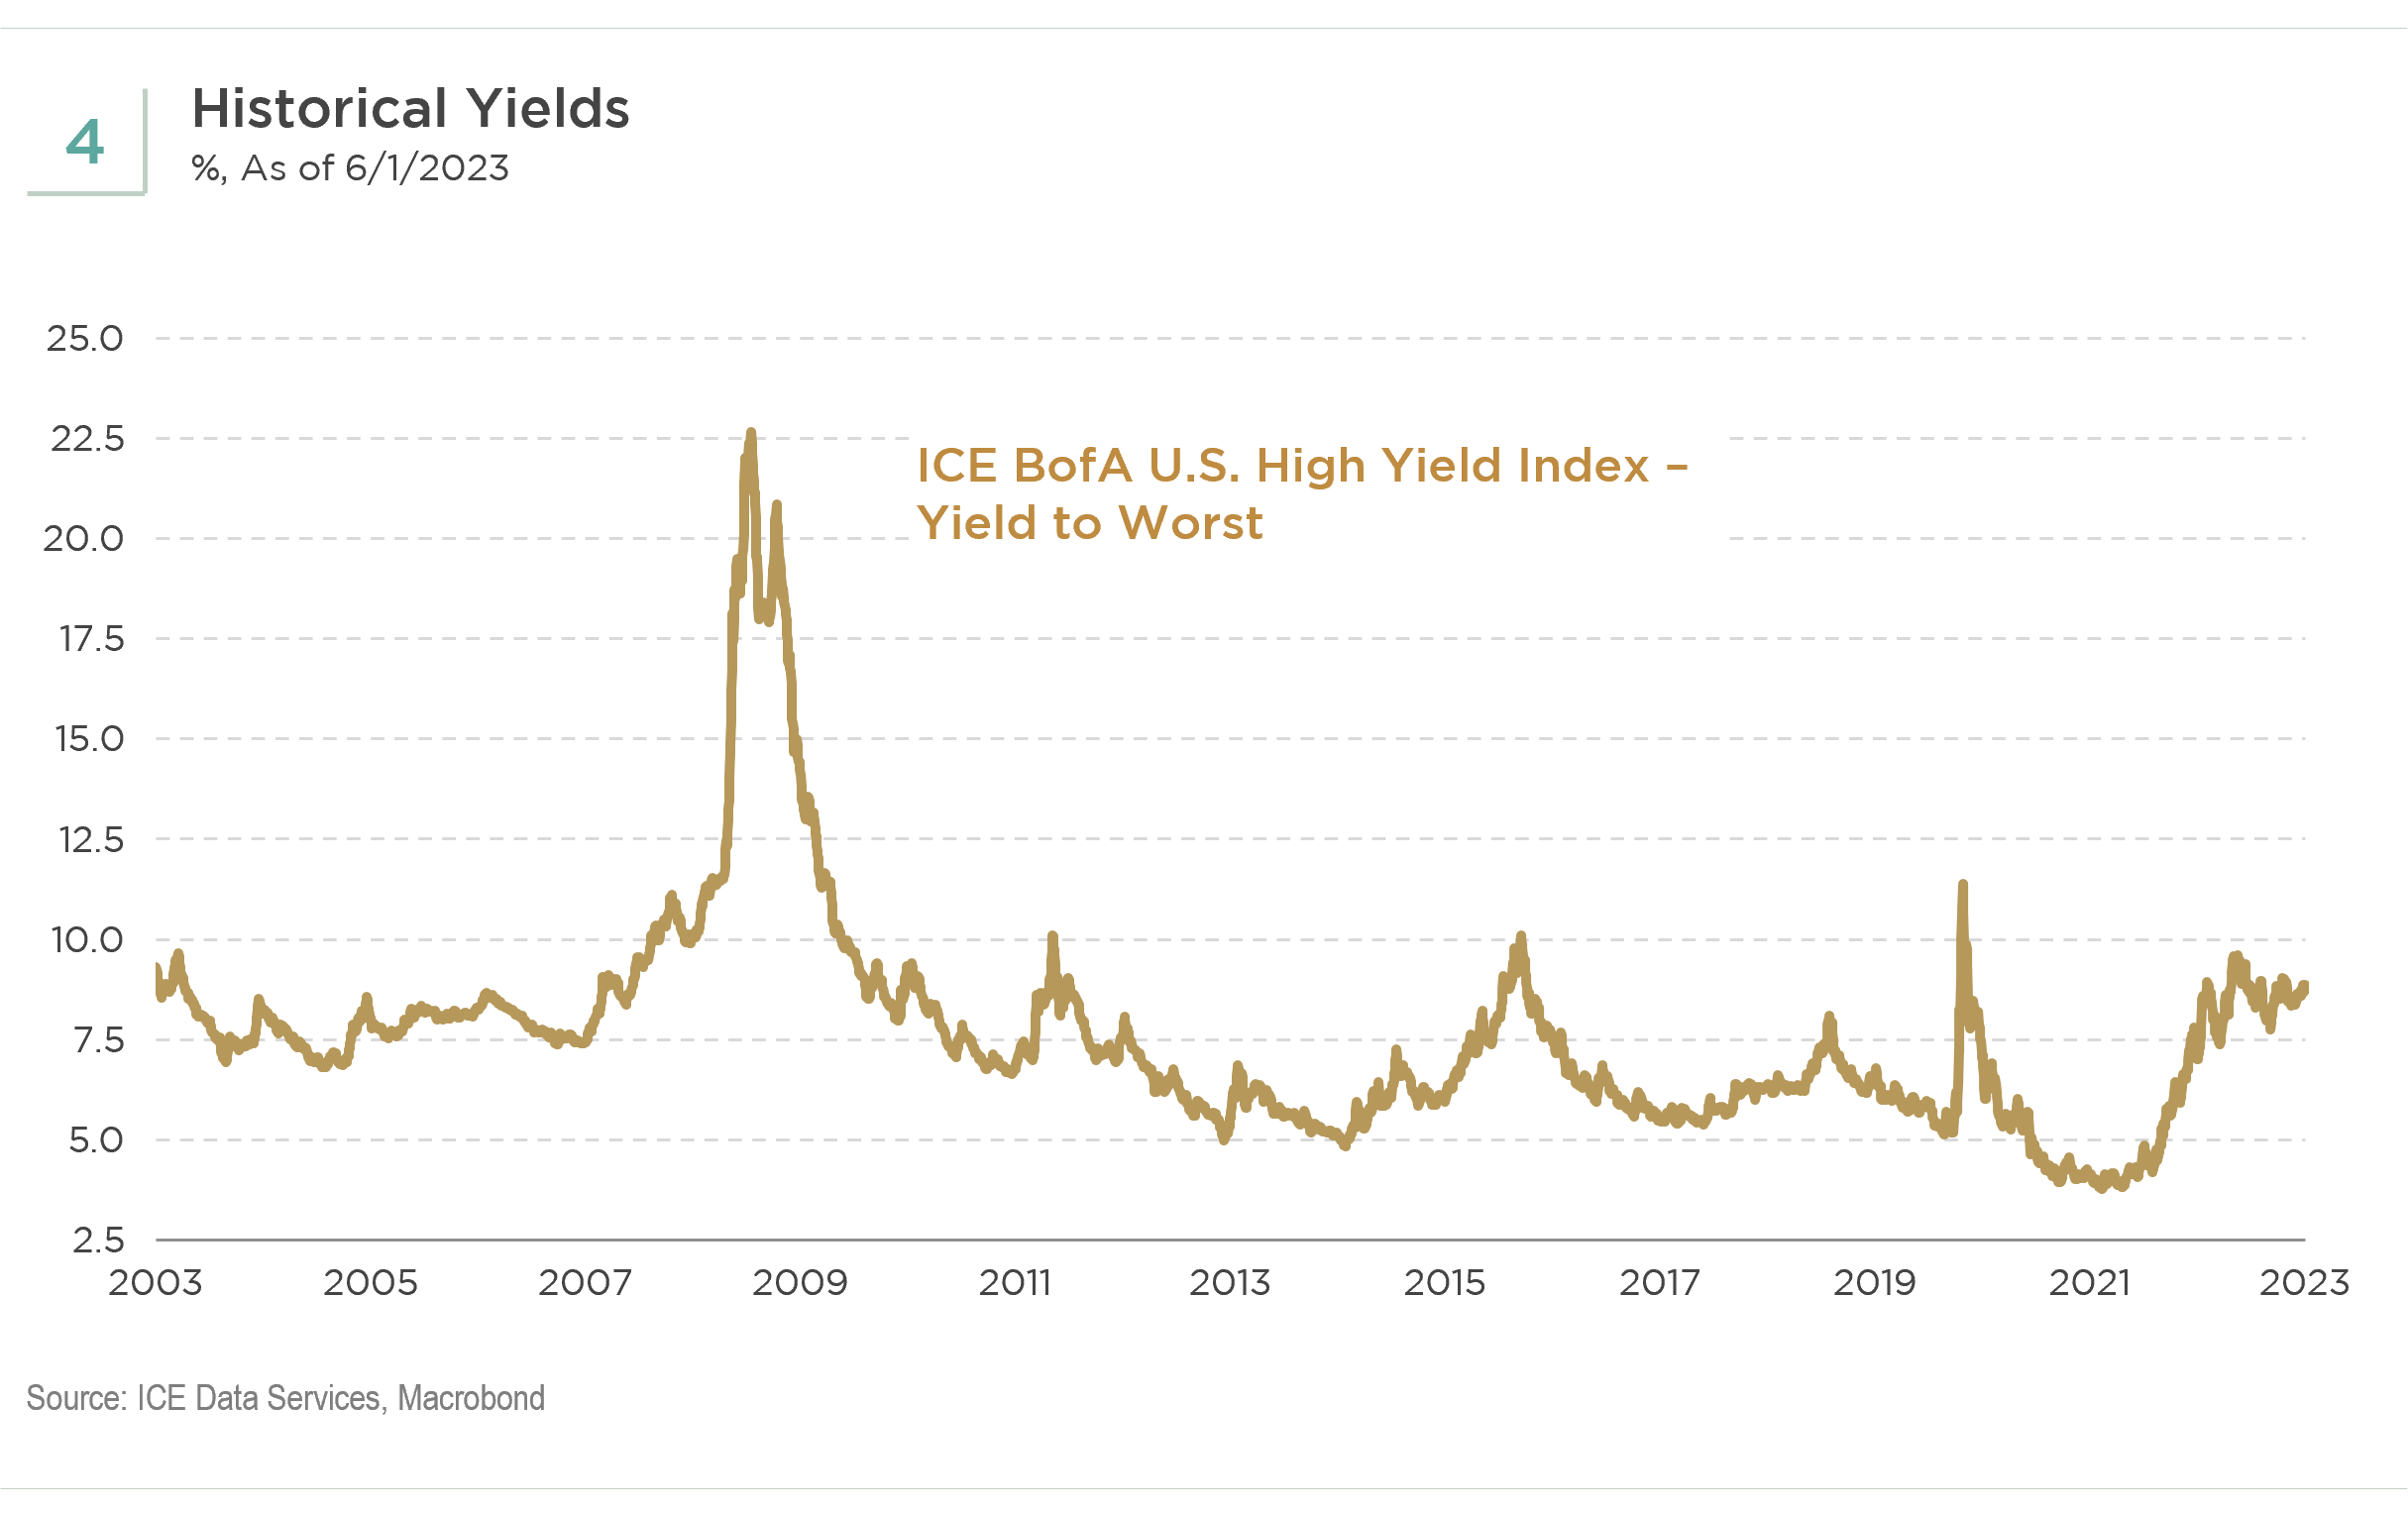
In a more difficult scenario, let us assume the high yield spread widens to 700 basis points over the next year and again assume the 5-year Treasury yield declines to 2.5%. Now the yield of the high yield market would be close to 10%. As we show in the chart below, with the exception of the Global Financial Crisis of 2008-2009, the yield of the high yield index has rarely been above 10% over the last 20 years (see Figure 4).
Many Investors Are Focused on the High Absolute Yield
A number of sophisticated investors understand that the potential risk/reward proposition of high yield at absolute yields in the 8-9% range has historically been favorable, and they have already committed capital or intend to do so. Based on our personal experience, media reports, and conversations with other market participants, we have seen interest in high yield from a wide variety of investors. Some dislocation funds, which are investment vehicles that call capital when a dislocation event or distressed opportunity occurs, have called capital to invest in high yield. Some pension funds, insurance companies, sovereign wealth funds, endowments and foundations, both inside and outside of the U.S., have been allocating to high yield. Even private credit and private equity funds appear to have taken advantage of the high absolute yields in the high yield market.
The table below shows how high yield has performed from the date the yield first eclipsed 8.5% in the last four cycles (see Figure 5).
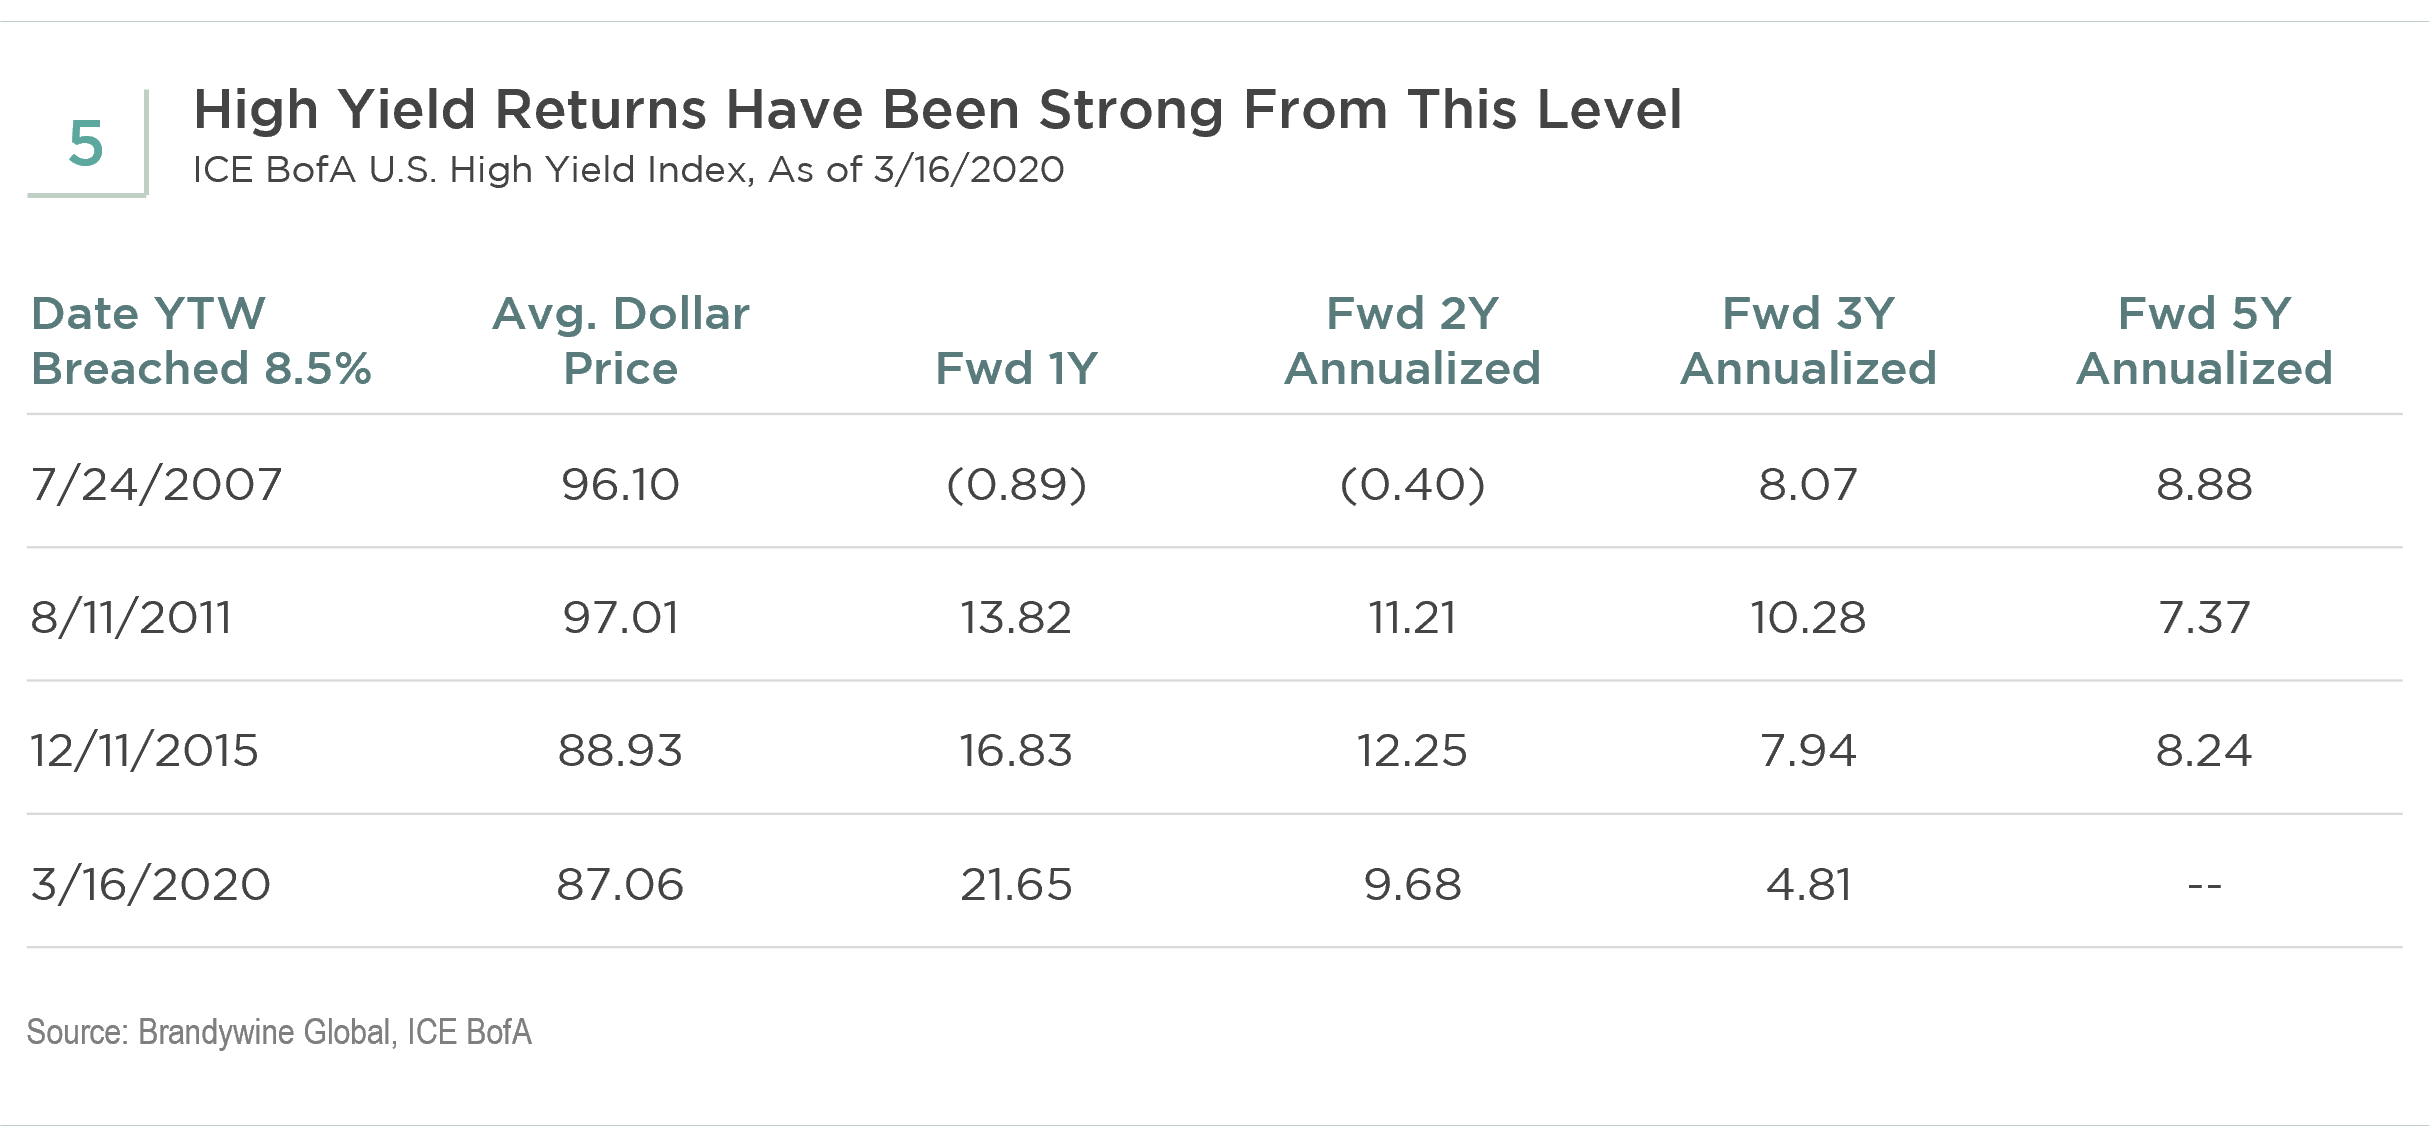
In the table above we introduce another important factor, which is the dollar price of the index. Today, the dollar price of the high yield index is below 88 cents compared to the mid-to high 90s in 2007 and 2011. The current price presents a more favorable proposition for potential price appreciation versus price depreciation.
Consider the first cycle in the table above. The yield was on its way from 8.5% in July 2007 to over 22% in December 2008. Three years later, the annualized total return was over 8%, and 5 years later it was almost 9%. The spread was 360 basis points in July 2007 compared to 470 basis points today. As discussed below, our forecast for the next 3-5 years is much more benign than the Global Financial Crisis.
The High Yield Spread Is Reasonable
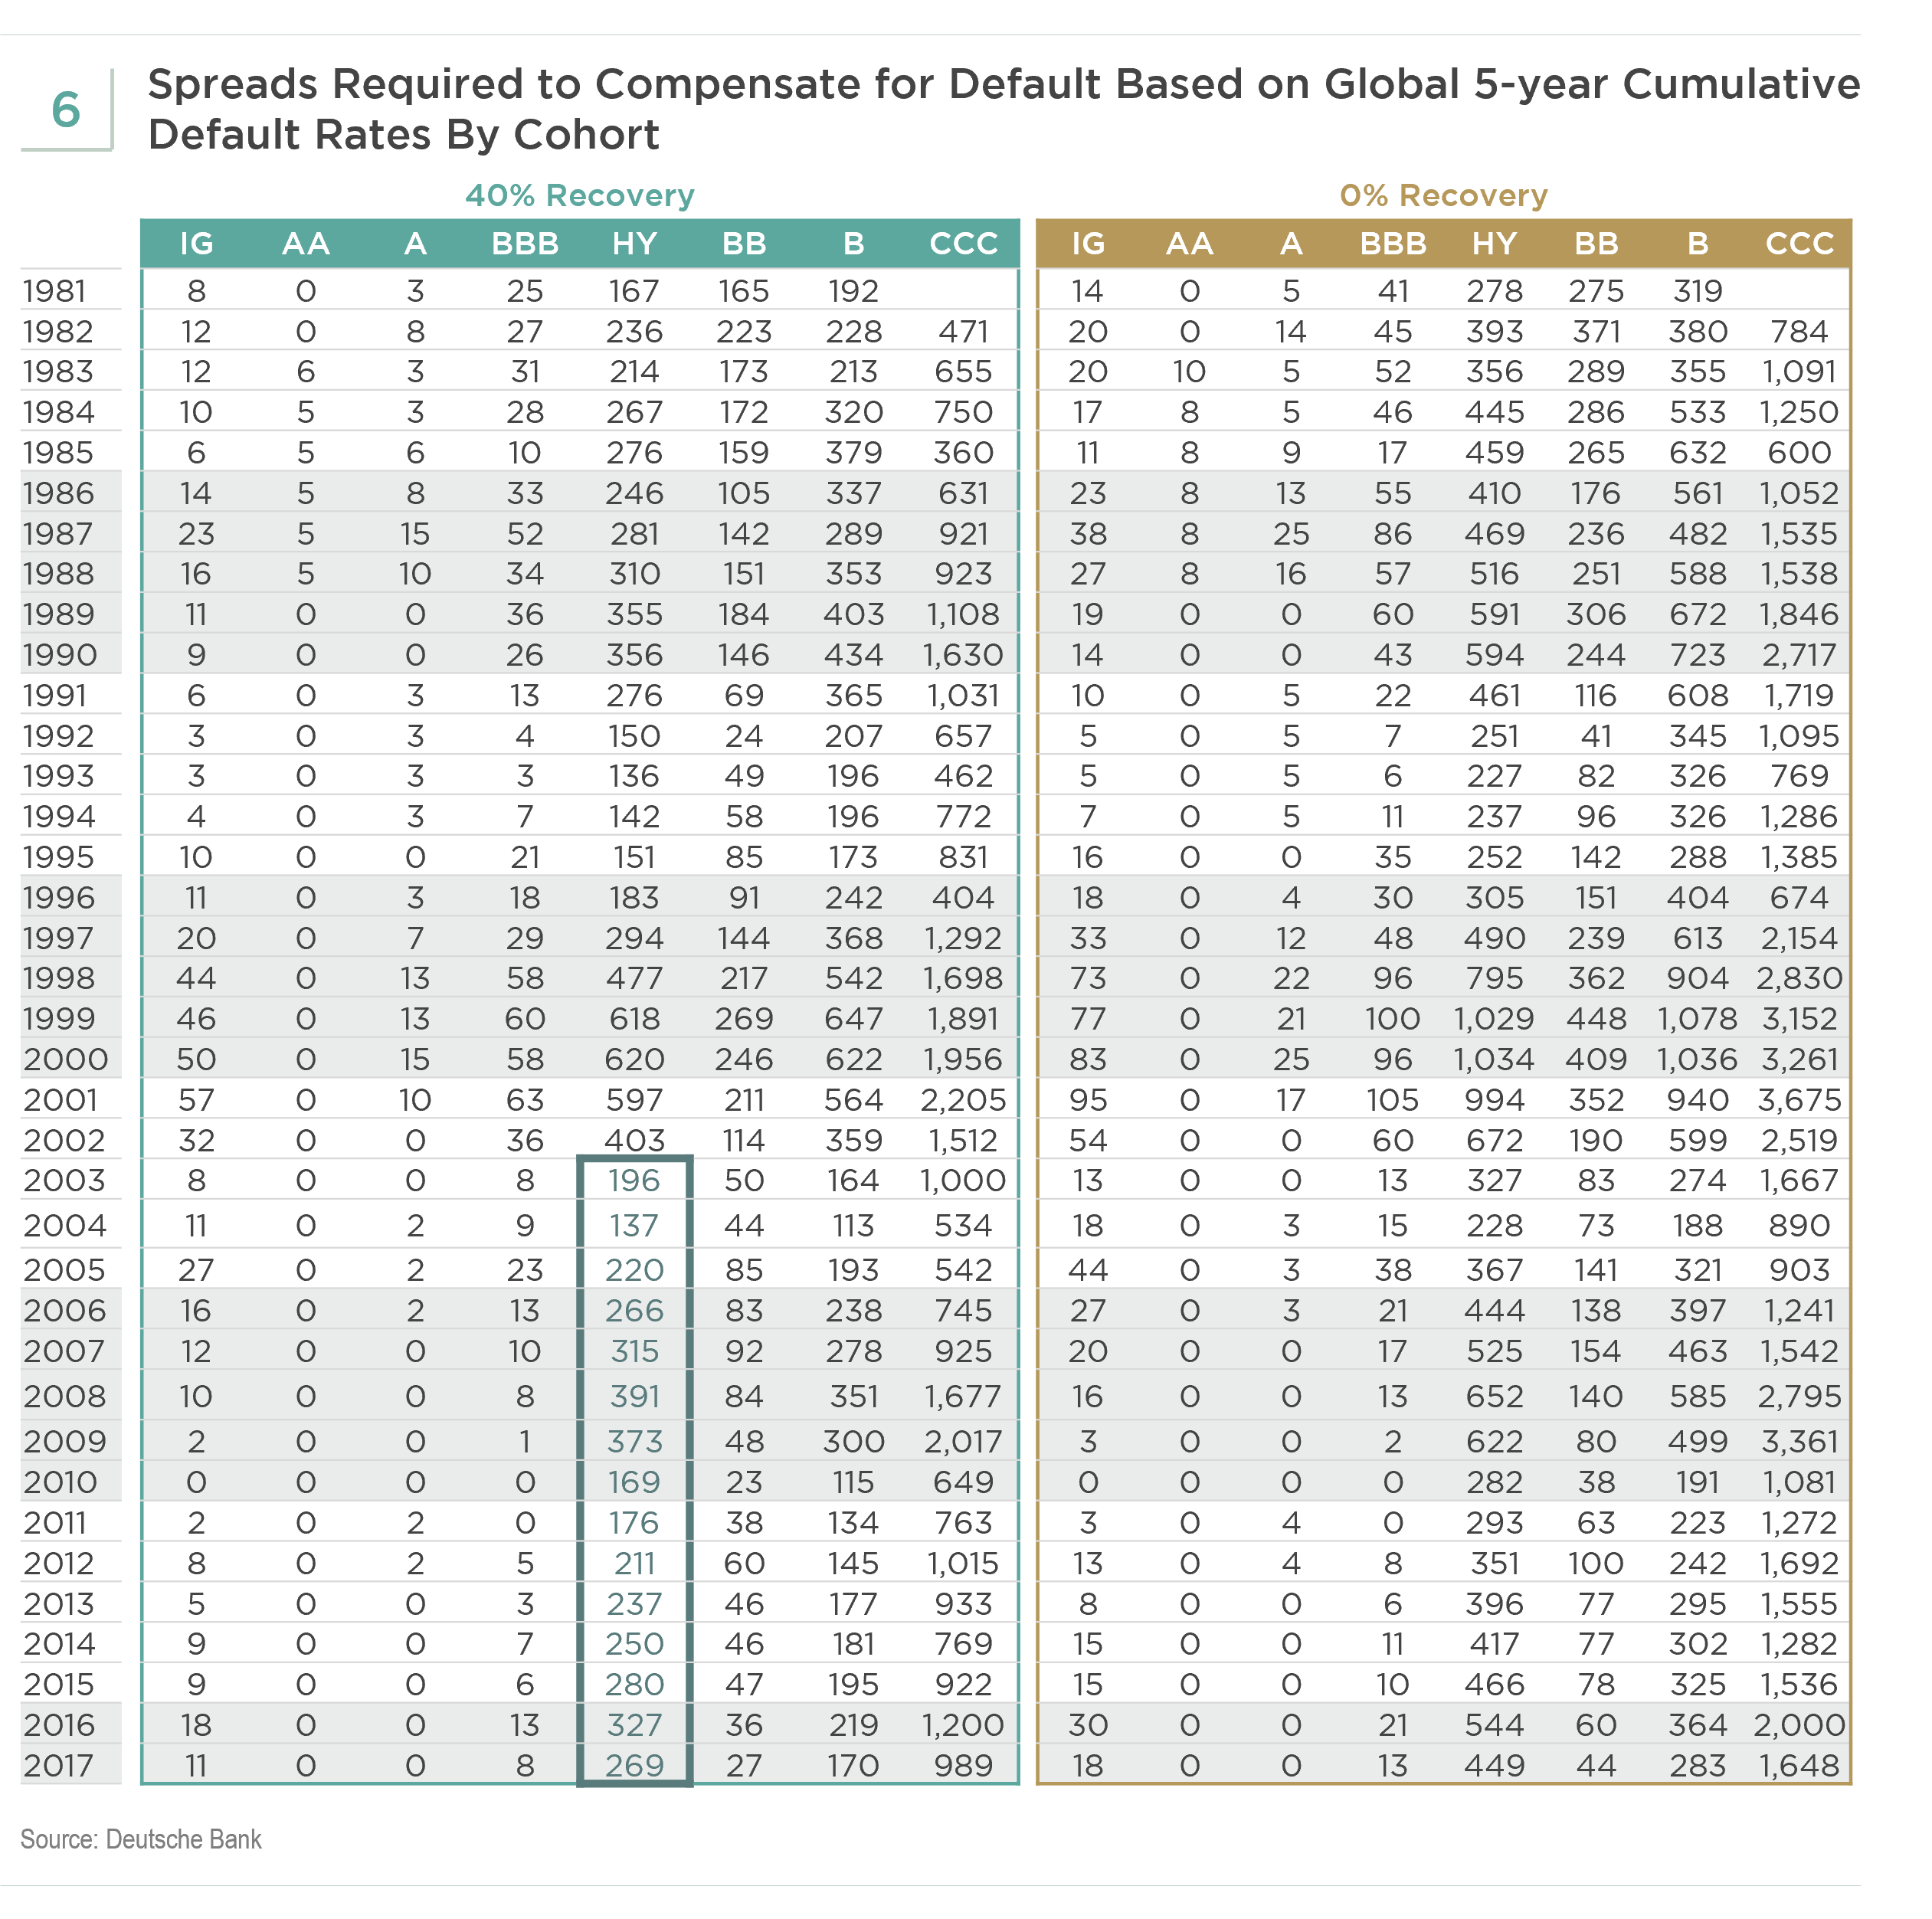
In the table below, Deutsche Bank updates their historical analysis of the spread required to compensate an investor for the global 5-year cumulative default rate, assuming a 40% recovery and a 0% recovery (see Figure 6). Focusing on the 40% recovery analysis, today’s spread of 470 basis points would have been well in excess of the spread required to compensate for 5-year cumulative defaults in every high yield cohort over the last 20 years, including the 2008 cohort.
There are a number of reasons why we expect defaults over the next five years to be much lower than they were in the Global Financial Crisis, but we will just touch on a few here. First, while only bit players in 2007-2009, leveraged loans and now private credit have grown to roughly equal one-third shares of the leveraged finance market along with high yield. Those two markets are where the growth has been over the last seven years. A rapidly growing asset class often attracts lower-quality credit. Meanwhile, the high yield market has skewed to larger, higher-rated issuers and more secured issues. We expect the private credit and leveraged loan markets to absorb a greater share of the defaults going forward.
Second, the high yield market is a fixed-rate market, much of which was put in place in 2020 and 2021 at very low coupons and extended maturities. These fixed-rate obligations are now being serviced with highly inflated assets and cash flows. These conditions are very different than the disinflationary credit crisis of 2007-2009.
Third, corporate management teams have had over one year to prepare for higher interest costs and recession. The vast majority also have had access to capital if needed. Many of these management teams have learned from the Global Financial Crisis and the pandemic, and we have great confidence in the adaptability of well-managed businesses. These corporate management teams are focused on yield more than spread. While there is some hedging of exposure to the base Treasury rate, the absolute yield is most relevant to the cost of capital for businesses.
Now Is a Good Starting Point for a Strategic Allocation to High Yield
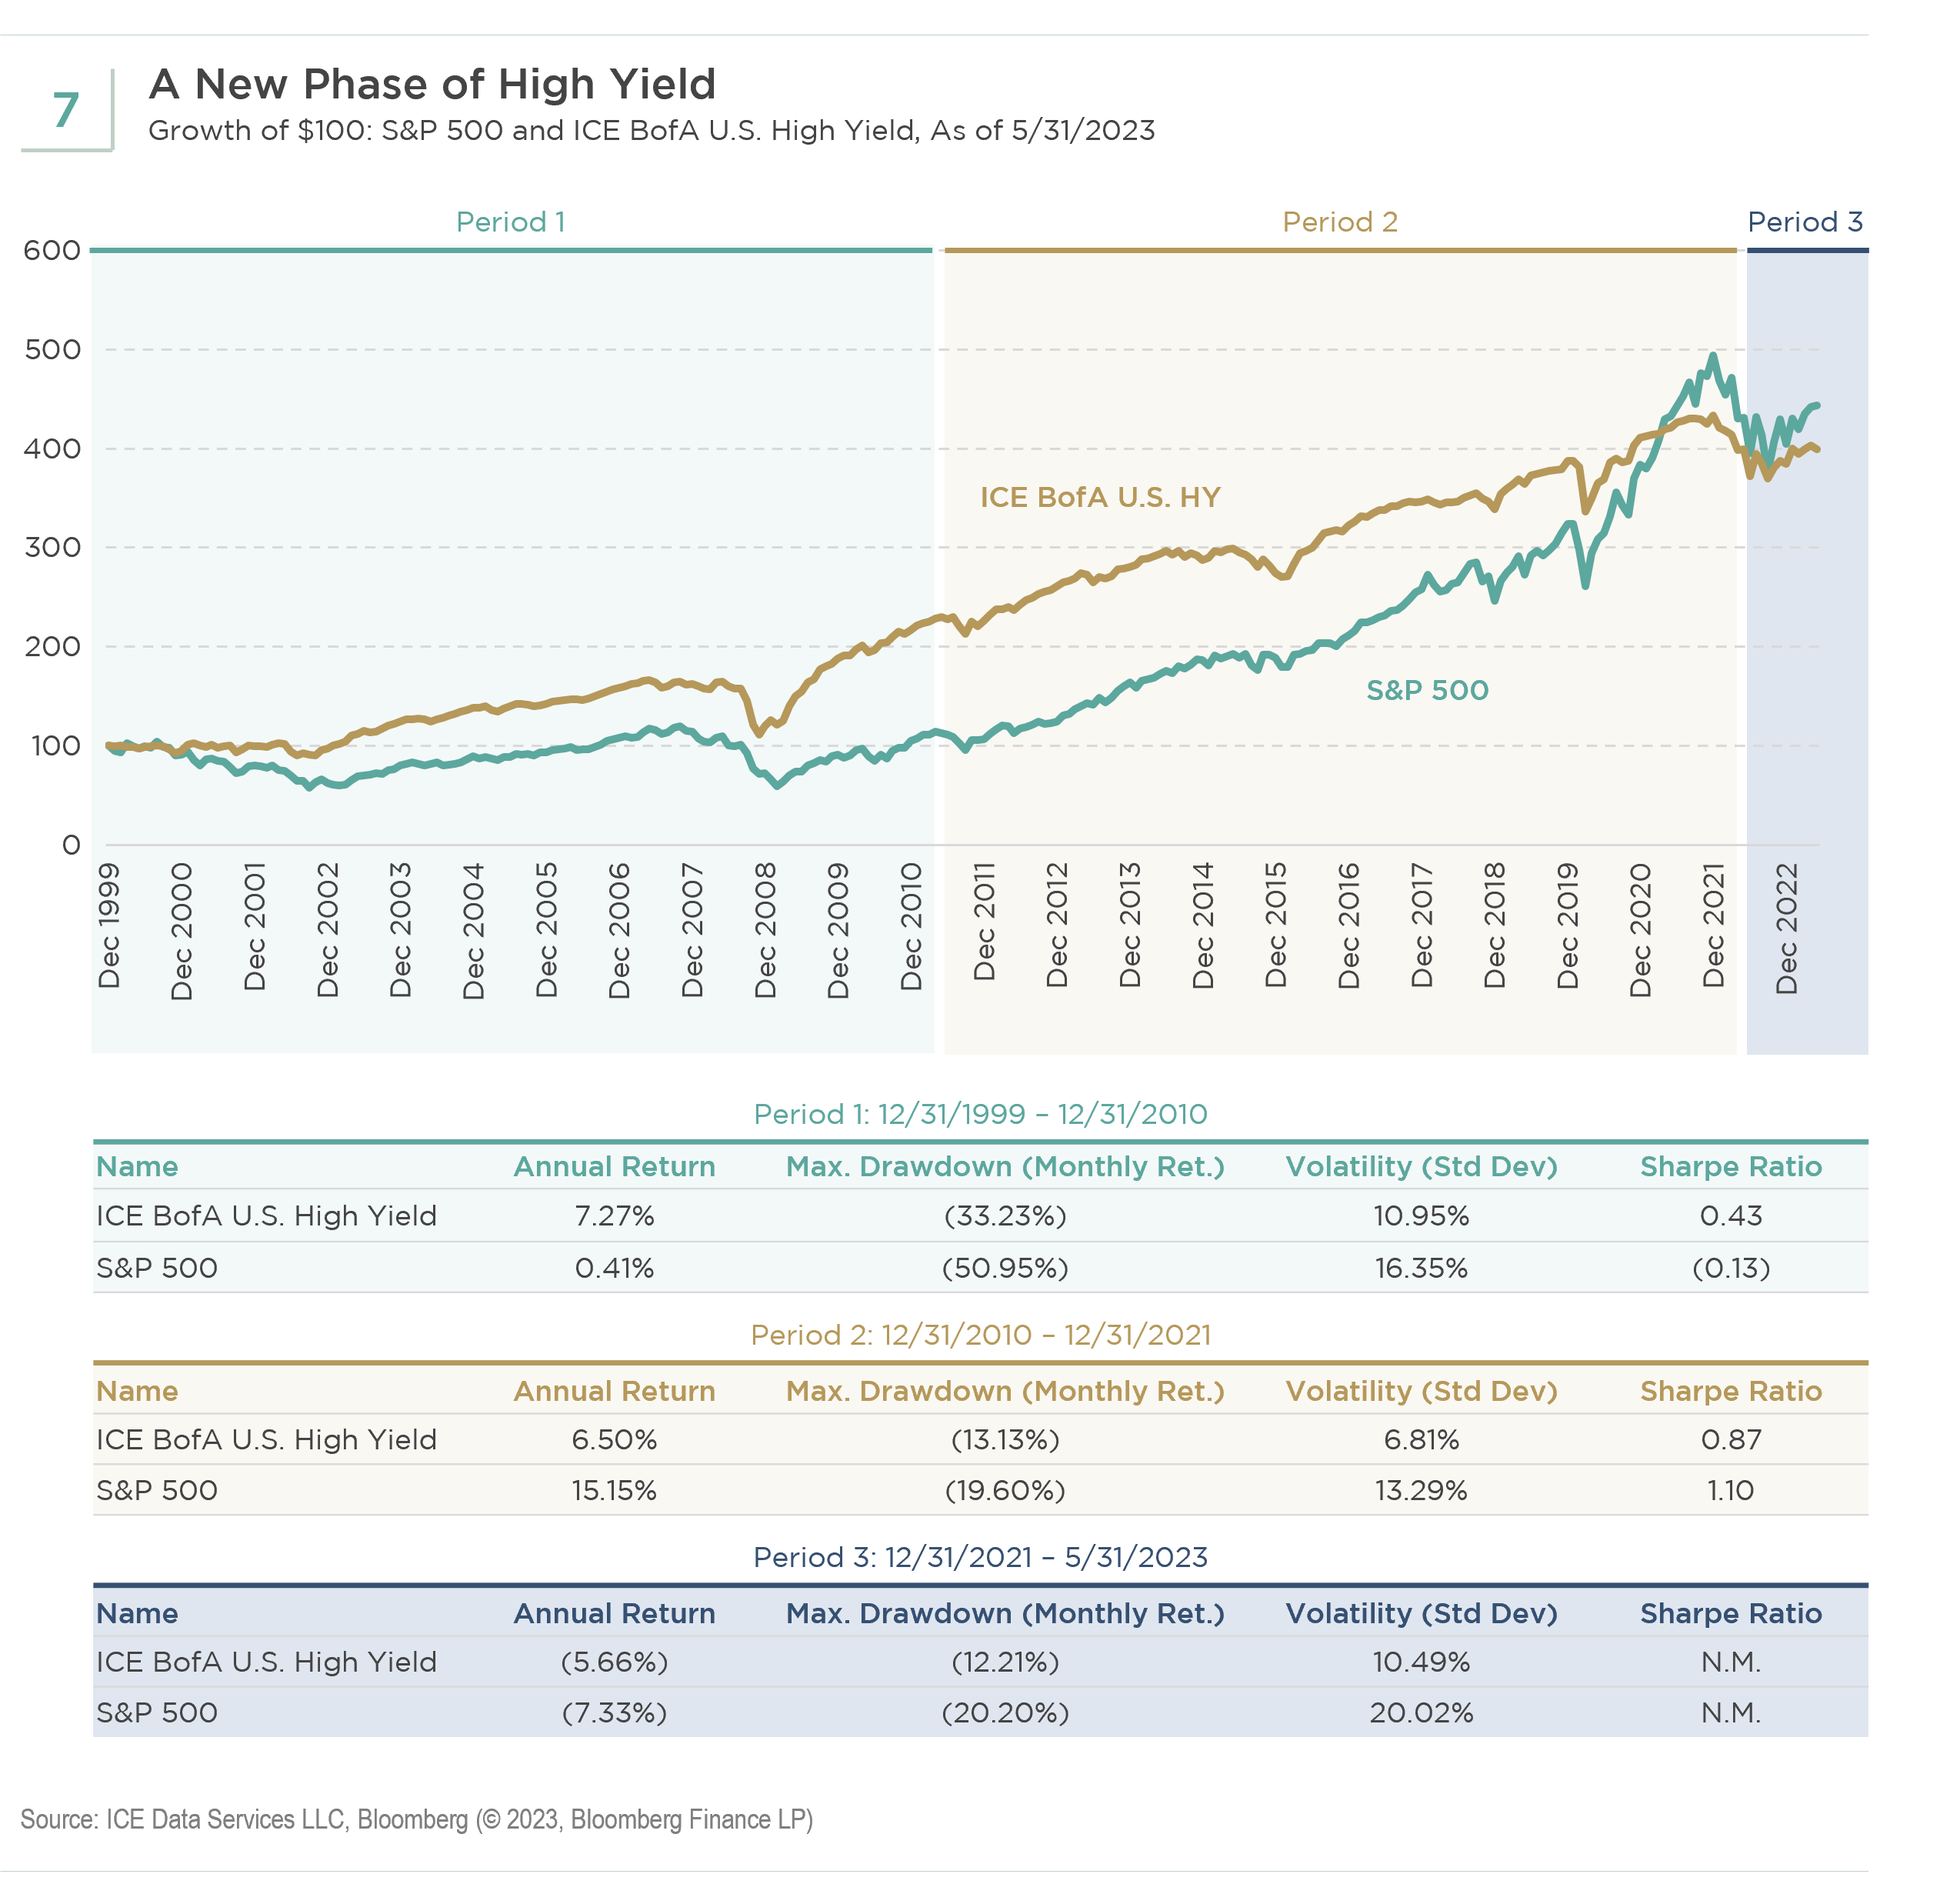
One reason why high yield has done well even through severe default cycles is that as the market reprices, investors can reinvest the significant contractual interest payments and principal proceeds at higher yields. Stocks, as represented by the S&P 500, experienced a lost decade (actually, eleven years) between the beginning of 2000 and the end of 2010. The graphic below shows that high yield generated an annualized total return over 7% over that 11-year period while the S&P 500 compounded at less than ½ of 1% (see Figure 7). The S&P 500 did far better over the subsequent 11-year period, but high yield still generated an annualized return of 6.5%. Time will tell, but we believe it is likely that the beginning of 2022 ushered in a new era where high yield returns will be far more competitive with the S&P 500.
We know that some investors hold to their high yield buy points of spreads between 600-800 basis points, based on rules of thumb coming out of the recession in the early 2000s and the Global Financial Crisis. But market participants, corporate management teams, and policymakers learn and adapt. There is no guarantee that an investor will get the same unbelievable buy points that were available in the past. We believe passing up a near 9% yield today runs the risk of missing out on a good opportunity to make a strategic allocation to high yield.
The ICE BofA U.S. High Yield Index tracks the performance of USD-denominated below investment grade corporate debt publicly issued in the major domestic markets.
The Bloomberg Global High Yield Index Index provides a broad-based measure of the global high-yield fixed income markets. The Global High Yield Index represents that union of the U.S. High Yield, Pan-European High Yield, U.S. Emerging Markets High Yield, CMBS High Yield, and Pan-European Emerging Markets High Yield Indices.
The Bloomberg U.S. Aggregate Bond Index represents securities that are SEC-registered, taxable, and dollar denominated. The index covers the U.S. investment grade fixed rate bond market, with index components for government and corporate securities, mortgage pass-through securities, and asset-backed securities.
The S&P 500 Index is a broad measure of U.S. domestic large cap stocks. The 500 stocks in this capitalization-weighted index are chosen based on industry representation, liquidity, and stability.
The Russell 2000 Index is a small-cap U.S. stock market index that represents the smallest 2,000 stocks in the Russell 3000 Index.
Groupthink is bad, especially at investment management firms. Brandywine Global therefore takes special care to ensure our corporate culture and investment processes support the articulation of diverse viewpoints. This blog is no different. The opinions expressed by our bloggers may sometimes challenge active positioning within one or more of our strategies. Each blogger represents one market view amongst many expressed at Brandywine Global. Although individual opinions will differ, our investment process and macro outlook will remain driven by a team approach.