

 Download PDF
There has been much discussion regarding whether the market has entered a value cycle, and if so, the cycle’s potential duration. During the pandemic’s earlier phases, growth stocks significantly extended the lead gained over value during the past decade. However, the prospect and eventual development and rollout of COVID-19 vaccines created a tailwind for value investing. Since September 2020, value stocks finally have rallied as the Russell 1000 Value Index has outperformed the Russell 1000 Growth by almost 21%. Many commentators have noted that value stocks reached an extreme discount to growth stocks last year and have remained substantially below relative historical levels even following the recent value rally.
Through extensive research, we have developed a proprietary tool to effectively identify and time the shifts between multi-factor deep value and broad value environments, which we incorporate into our investment models. However, we recognize that this valuation tool alone sometimes predicts value rallies that do not materialize. Subsequently, we also analyzed the U.S. market’s supply of growth stocks as a trigger for a new value cycle, but similarly, our work showed that this information sometimes gives false positive signals. We then conducted further research and found that the combination of discounted value and scarce growth stock supply accurately predicted each long-term value rally over the last 40 years. Perhaps even more important, the combination of these two signals currently suggests the potential for an extended value recovery.
Valuation Spreads: A Mostly Reliable Value Cycle Indicator
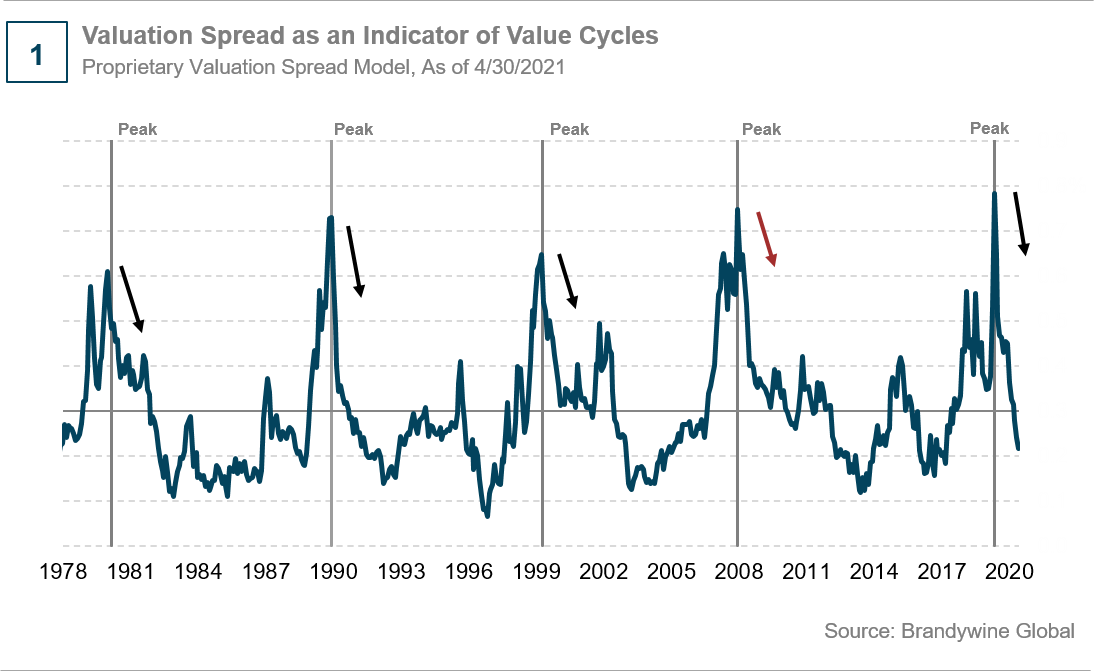
The chart below depicts our valuation spread tool’s effectiveness in signaling value regimes (see Chart 1). The calculation consists of a normalized spread based on price-to-book ratios (P/B) between the median of the cheapest quartile of stocks versus the median of the overall market. Since the early 1980s, we see that value cycles often began after this spread peaked, indicated by the black arrows in the chart. When spreads narrowed from their highs, the value cycle soon began in four of the past five occurrences. While the spread narrowing successfully triggered a switch between value environments within our multi-factor model, turning in 2009, it incorrectly signaled value outperforming growth, denoted by the red arrow on the chart.
Growth Stock Supply: Another Fair Predictor of Value Cycles
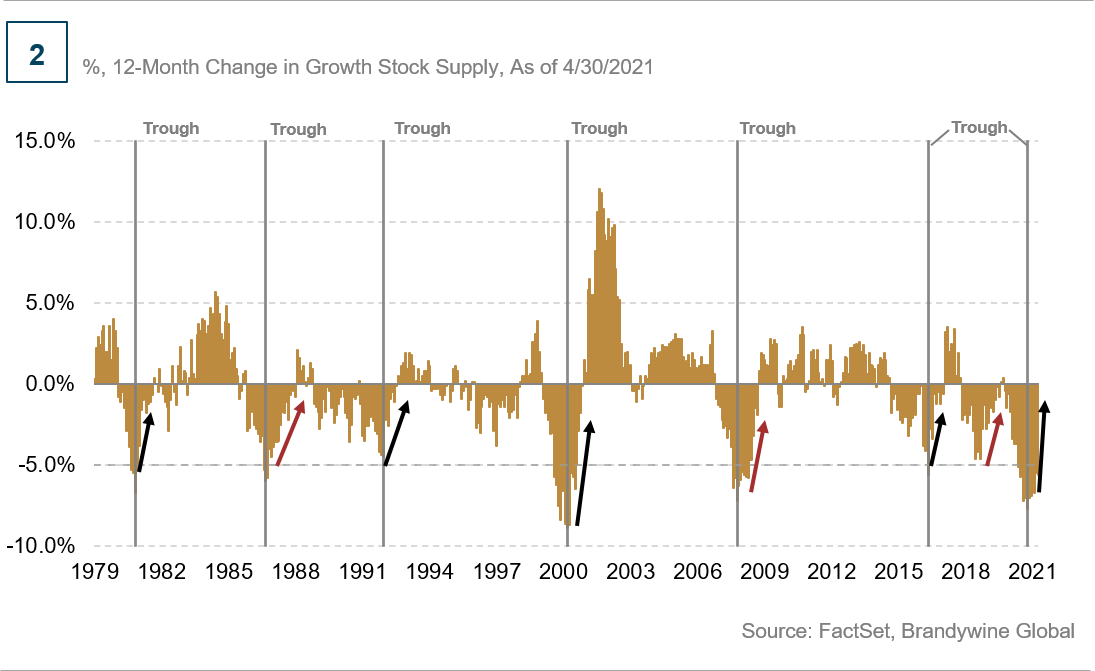
An analysis of the net change in growth stock supply available in the U.S. equity market provides another potential method for predicting value cycles. Our definition of a growth stock is one with five years of sales growth greater than the weighted average of the largest 1,000 U.S. stocks. When the number of growth names decreases, growth often outperforms as investment pours into this limited supply. However, as these fewer names are unable to sustain their growth rate, a broader group of less extraordinary growers begins to lead the way, resulting in an abundance of growth supply. At this point, value often outperforms.
Once the percentage of growth names decreased by at least 4% over a 12-month period, the number of growth names soon bottomed and began to increase again, and value outperformed (see Chart 2). This indicator would have worked in predicting the start of value cycles or a strong value rally in four of the seven occurrences as indicated by the black arrows. In 1986, 2008, and 2018, the growth supply bottom was a false value signal.
Combined Signal Is the Strongest Indicator of Value Outperformance
We found that overlaying these two models significantly increases their predictive power. The combined model requires two conditions:
- Valuation spread must be reverting from an extended peak;
- The 12-month change in growth supply also must be declining.
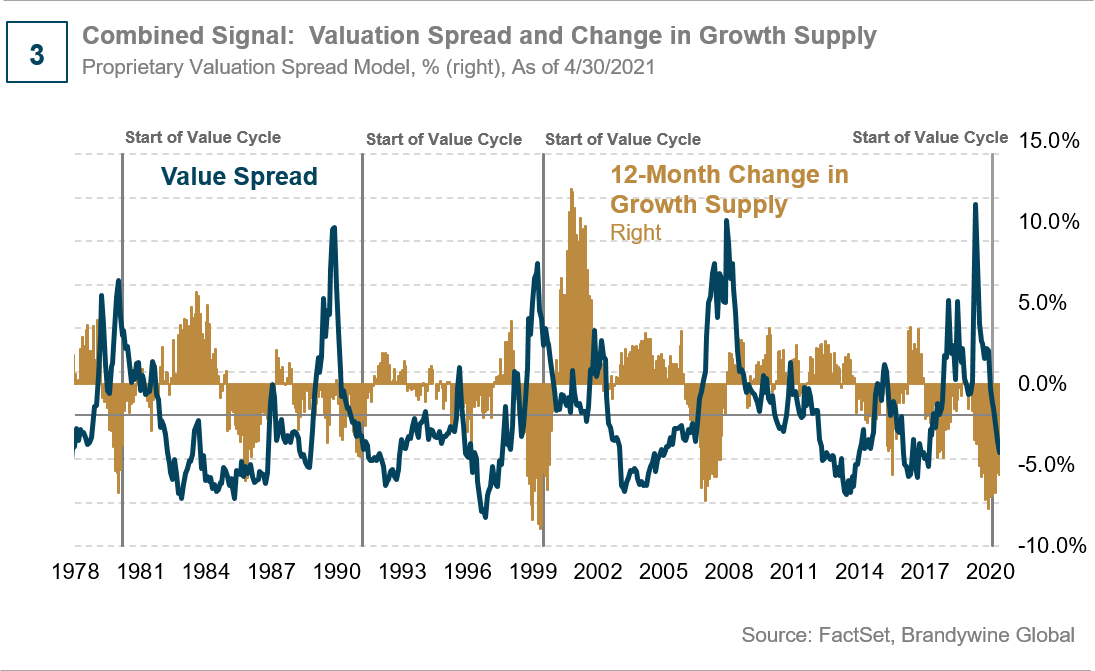
The chart below shows the enhancement to the signal when incorporating growth supply with valuation spreads; the combined model eliminates the inaccurate value cycle signals (see Chart 3). For instance, as you can see in 2009, spreads narrowed from their peak, but the 12-month change in growth names had already reverted in 2008, so value did not outperform.
Similarly, since the valuation spread was not peaking in 1986 or 2018, the combined modeling tool eliminates the inaccurate signals from the growth supply in those periods. As a result, the highest probability of a material value cycle occurs when spreads are narrowing from their peak and growth supply decreased by 4% over the previous 12 months.
Current Signals Point to Multi-Year Value Recovery
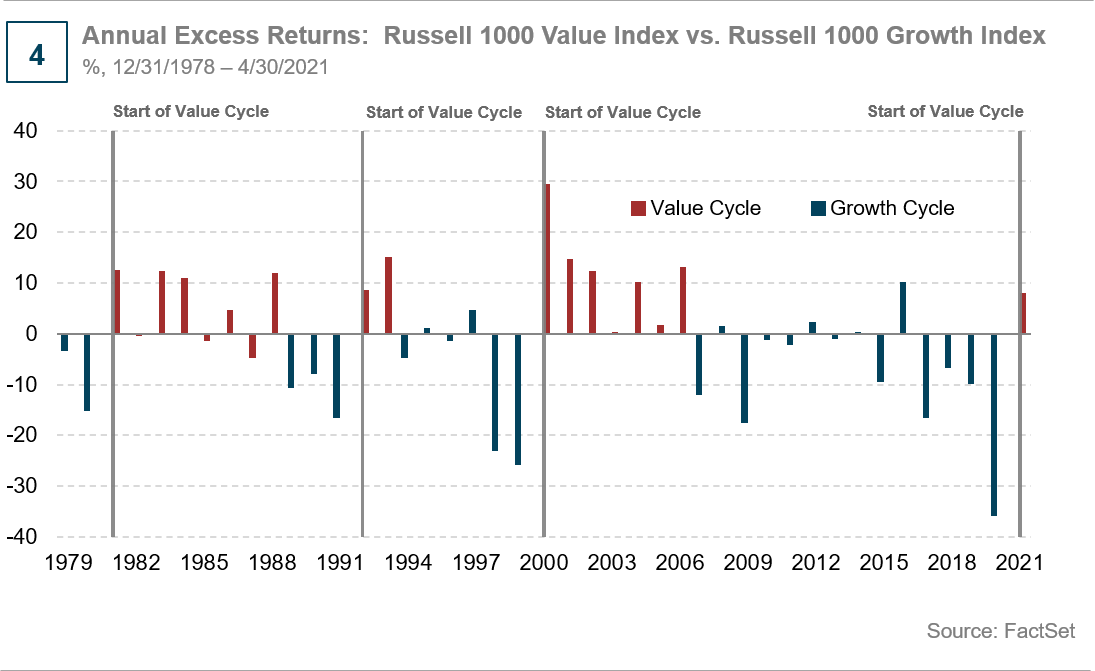
The chart below looks at annual excess returns of the Russell 1000 Value Index versus the Russell 1000 Growth Index (see Chart 4). Our combined signal accurately predicted the start of each long-term value cycle. While there are only a few cycles to analyze over the last 40 years, the valuation spreads and changes in the supply of growth stocks make intuitive sense to us. Furthermore, in addition to predicting value cycles, these signals may give some indication of the potential duration of the next cycle. Our current equity environment at the end of April is a useful example. Value is leading growth by roughly 8% year to date. Technology companies are underperforming while prospects of a full economic reopening have led energy, financials, and other cyclical companies to outperform. As growth companies are unable to sustain their growth rates, and many value and cyclicals are improving their sales growth, the percentage of growth names is increasing while valuation spreads continue to narrow, supporting the outperformance of value. Currently, spreads have narrowed significantly since March 2020. However, the 12-month change in growth supply is still below the 4% threshold, which should signal a multiple-year value recovery ahead.
Groupthink is bad, especially at investment management firms. Brandywine Global therefore takes special care to ensure our corporate culture and investment processes support the articulation of diverse viewpoints. This blog is no different. The opinions expressed by our bloggers may sometimes challenge active positioning within one or more of our strategies. Each blogger represents one market view amongst many expressed at Brandywine Global. Although individual opinions will differ, our investment process and macro outlook will remain driven by a team approach.